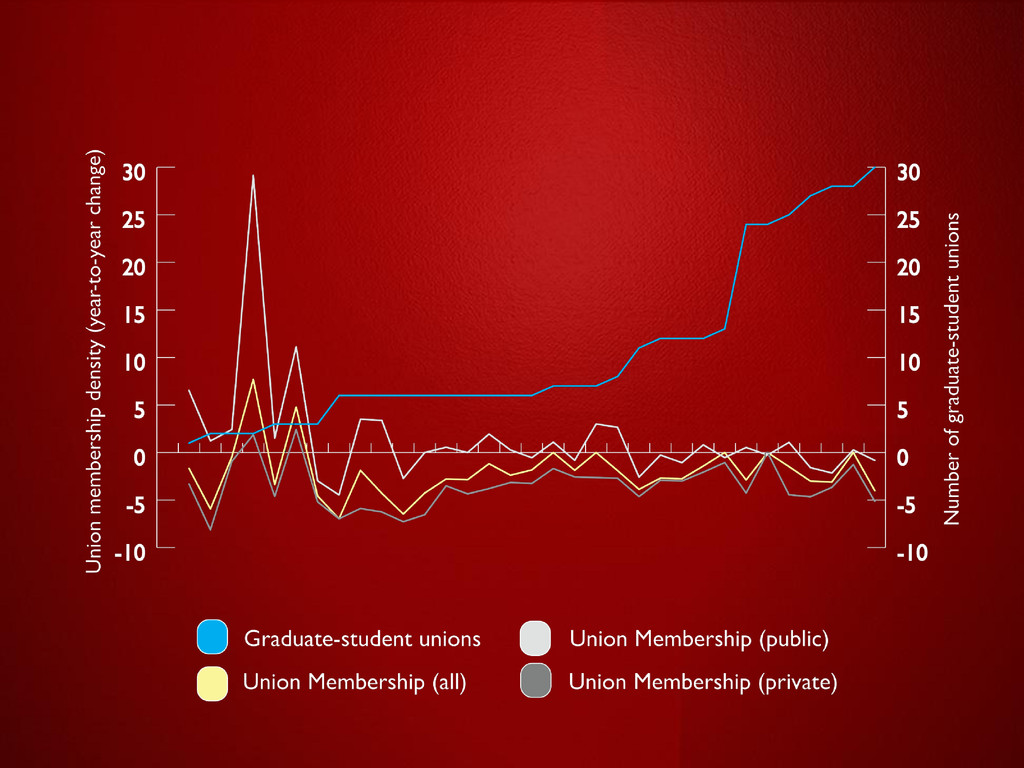
degrees and spending more time as graduate assistants...Meanwhile, outside monies from the federal government has decreased...Graduate students, particularly in the humanities, are facing a tighter job market…universities are cutting back on the number of tenured faculty positions being offered, and some real wages have fallen. (p. 7) ”
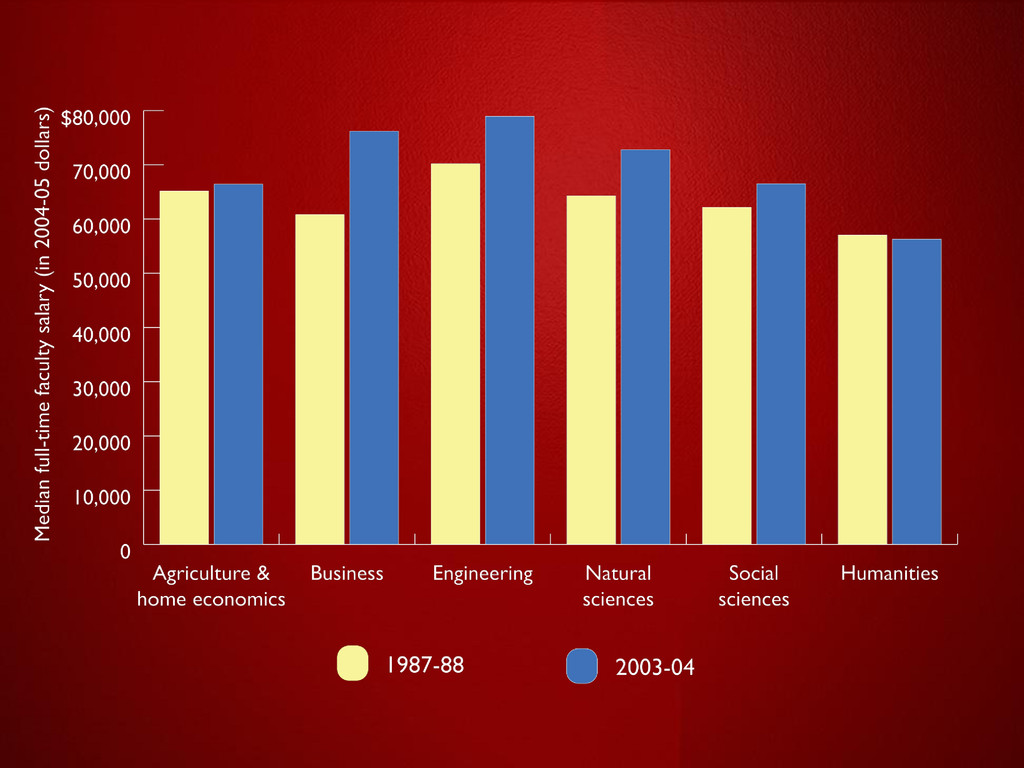
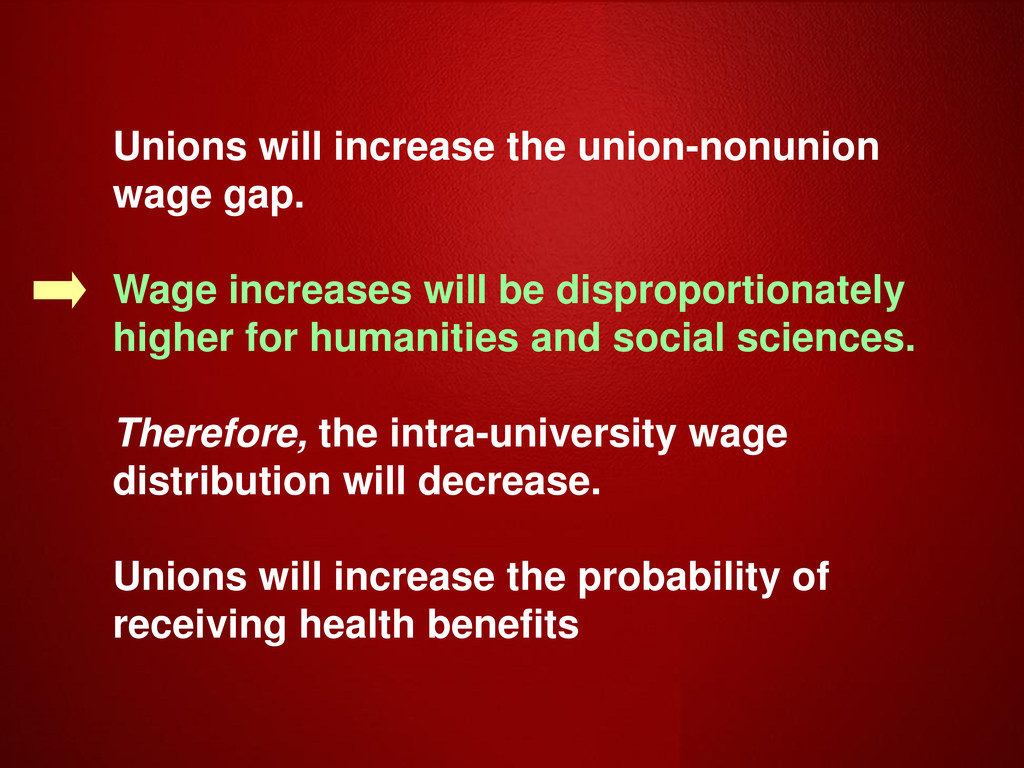
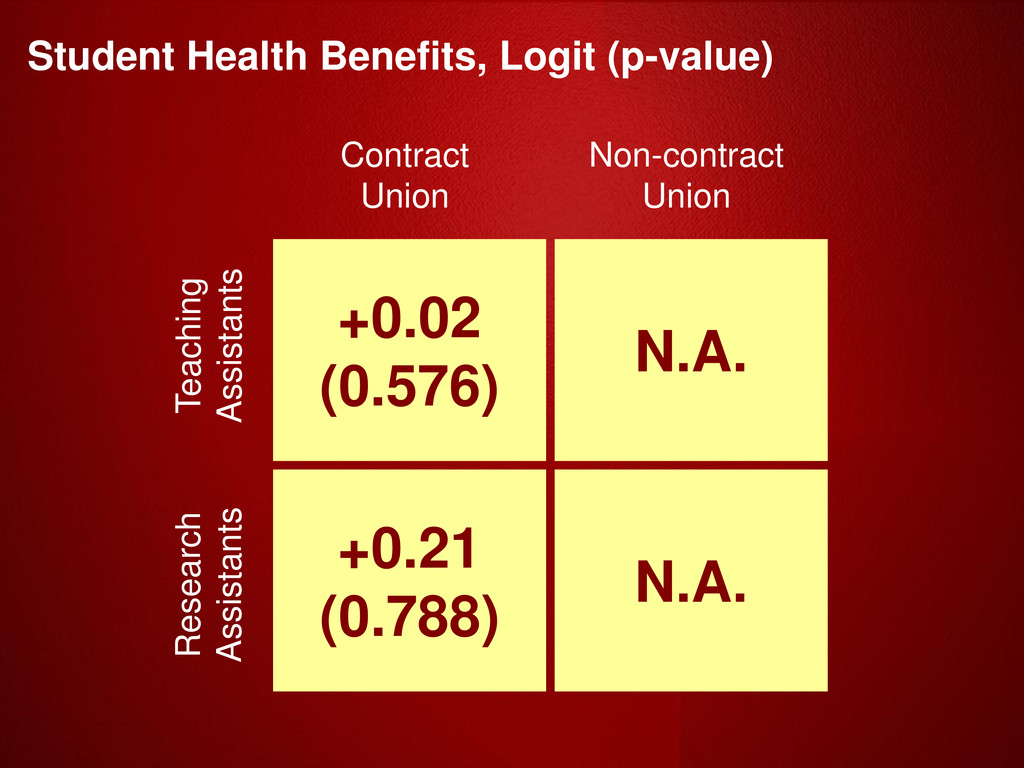
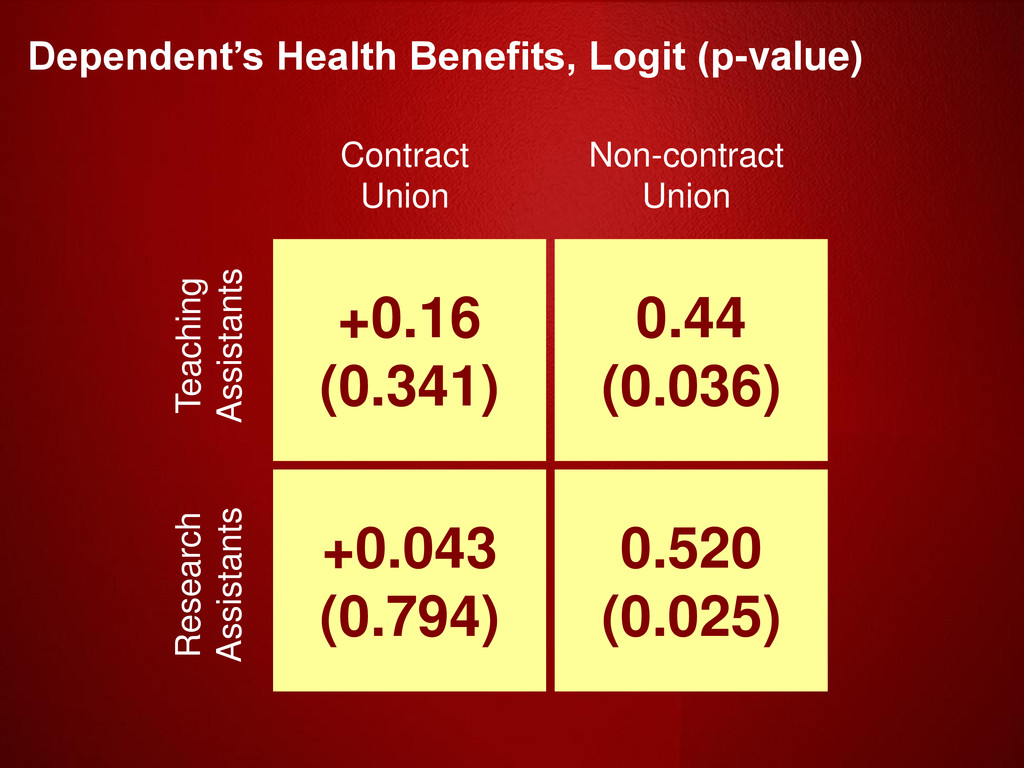
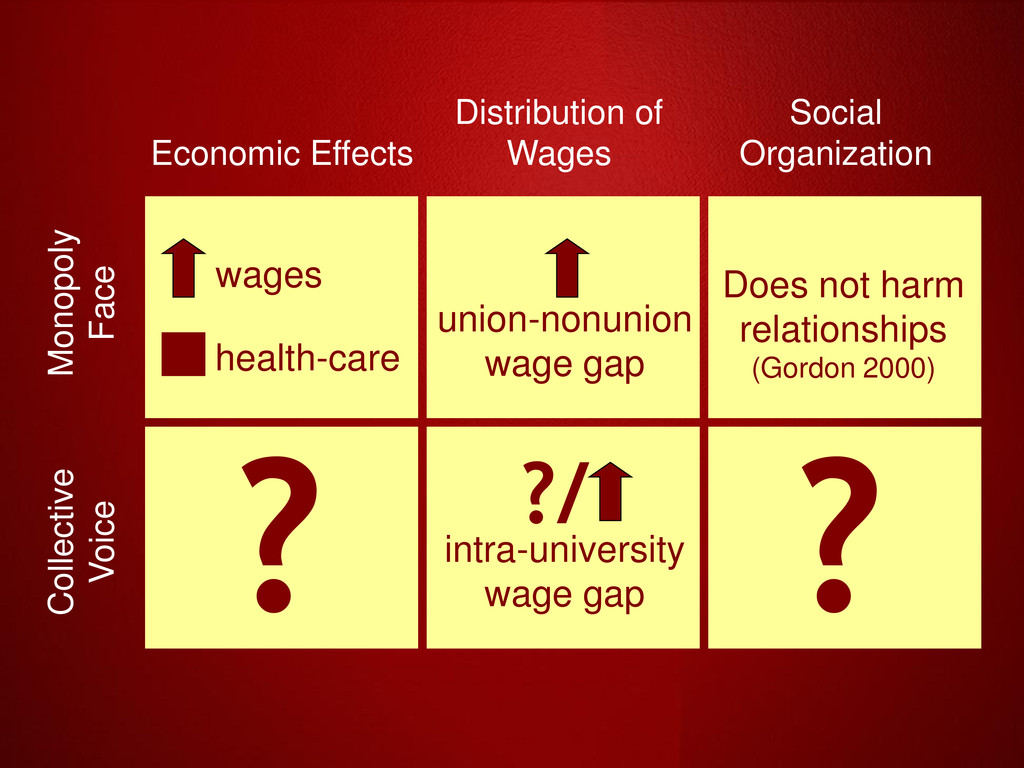
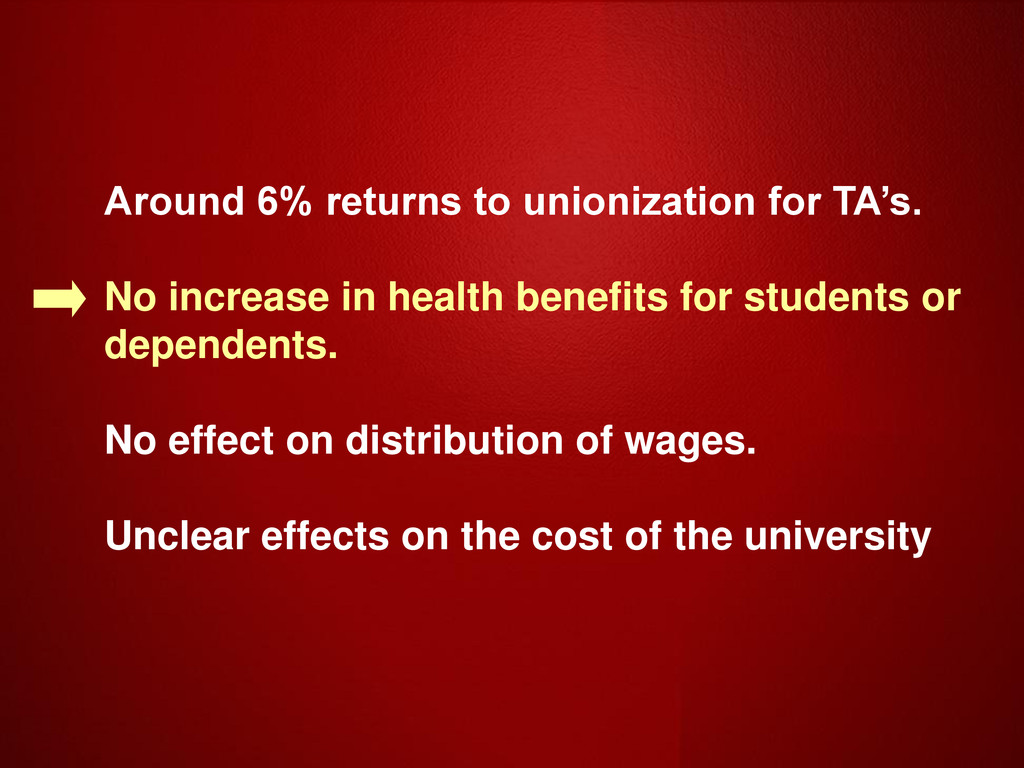
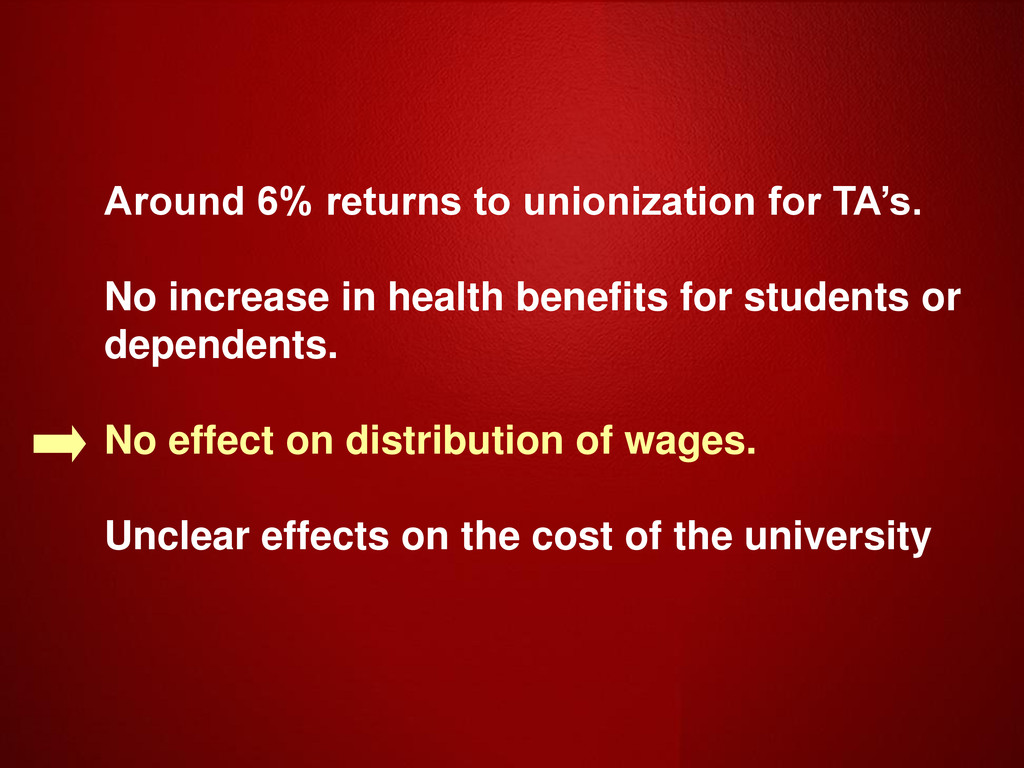
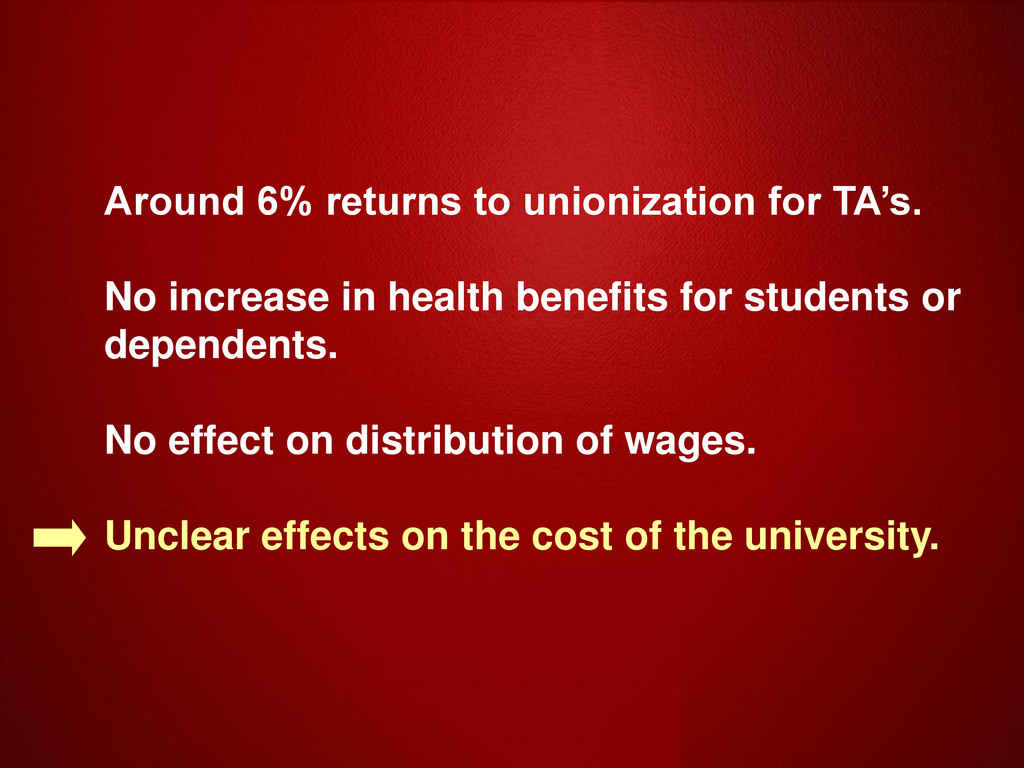
be disproportionately higher for humanities and social sciences. Therefore, the intra-university wage distribution will decrease. Unions will increase the probability of receiving health benefits
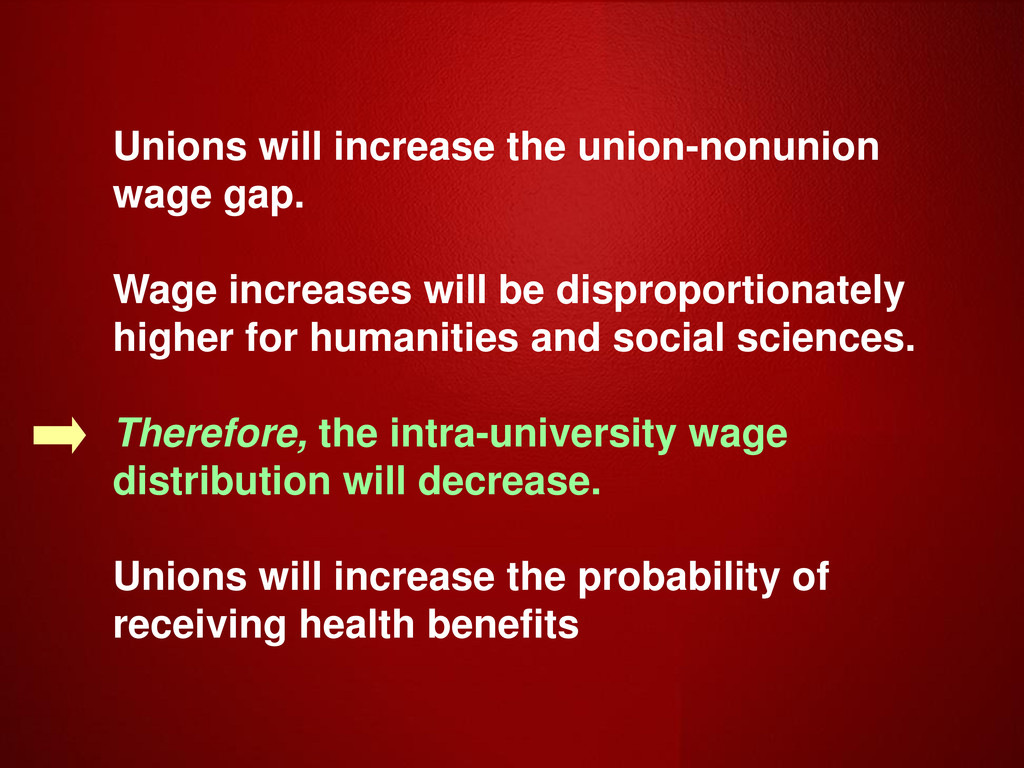
be disproportionately higher for humanities and social sciences. Therefore, the intra-university wage distribution will decrease. Unions will increase the probability of receiving health benefits
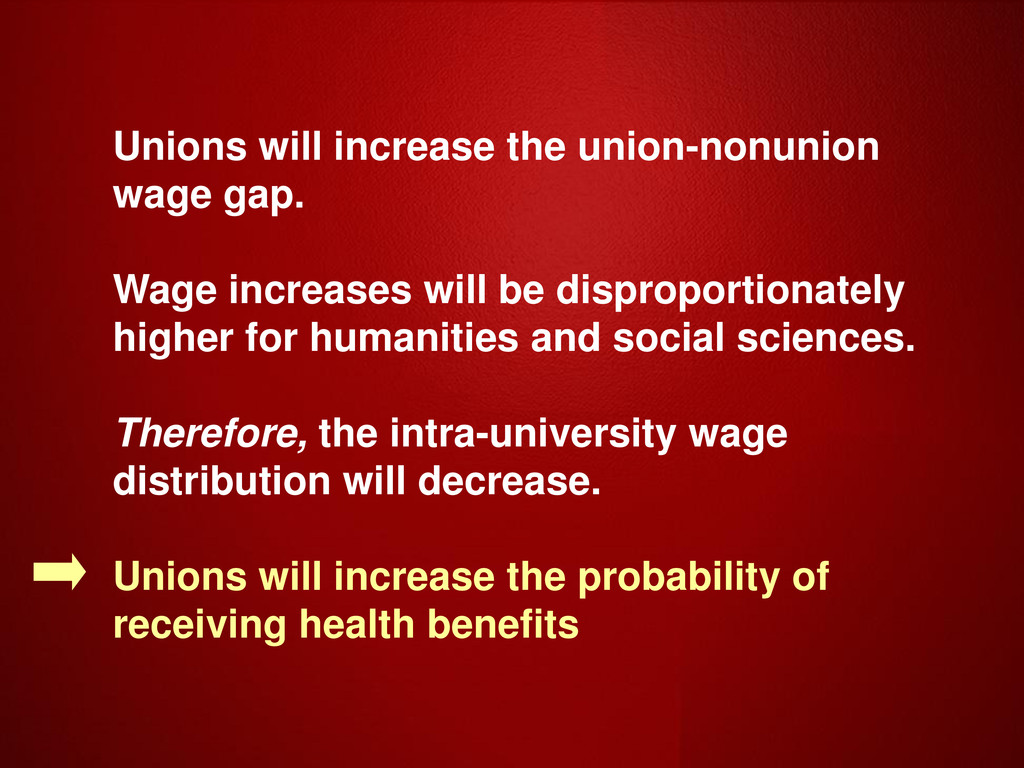
be disproportionately higher for humanities and social sciences. Therefore, the intra-university wage distribution will decrease. Unions will increase the probability of receiving health benefits
be disproportionately higher for humanities and social sciences. Therefore, the intra-university wage distribution will decrease. Unions will increase the probability of receiving health benefits
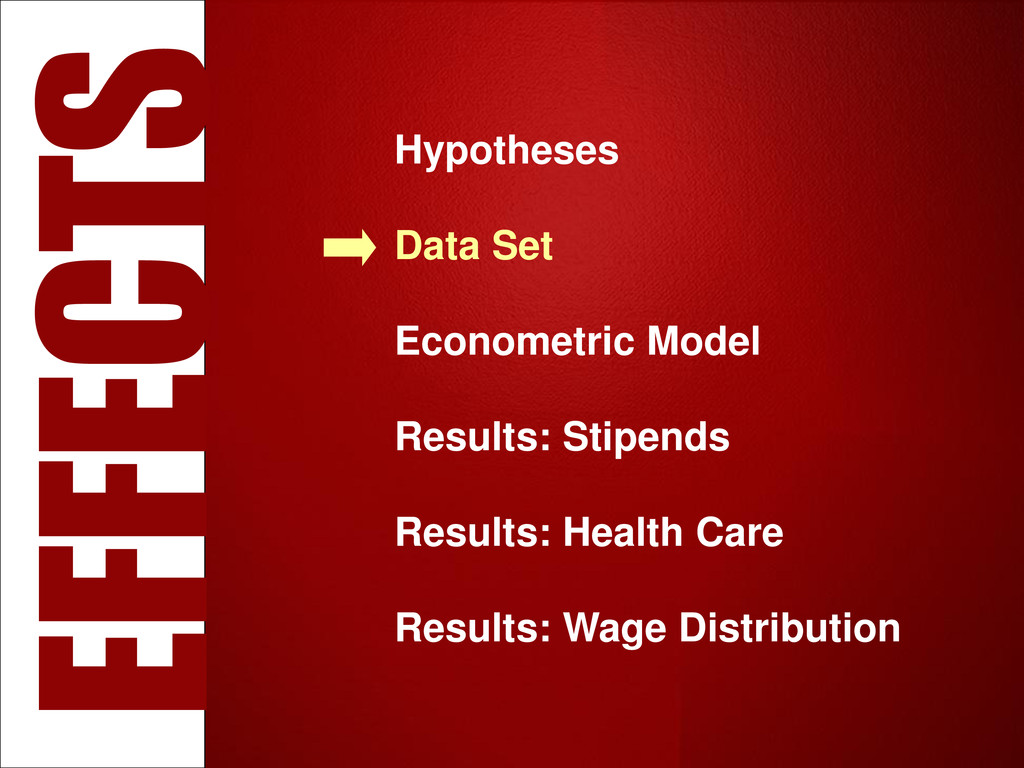
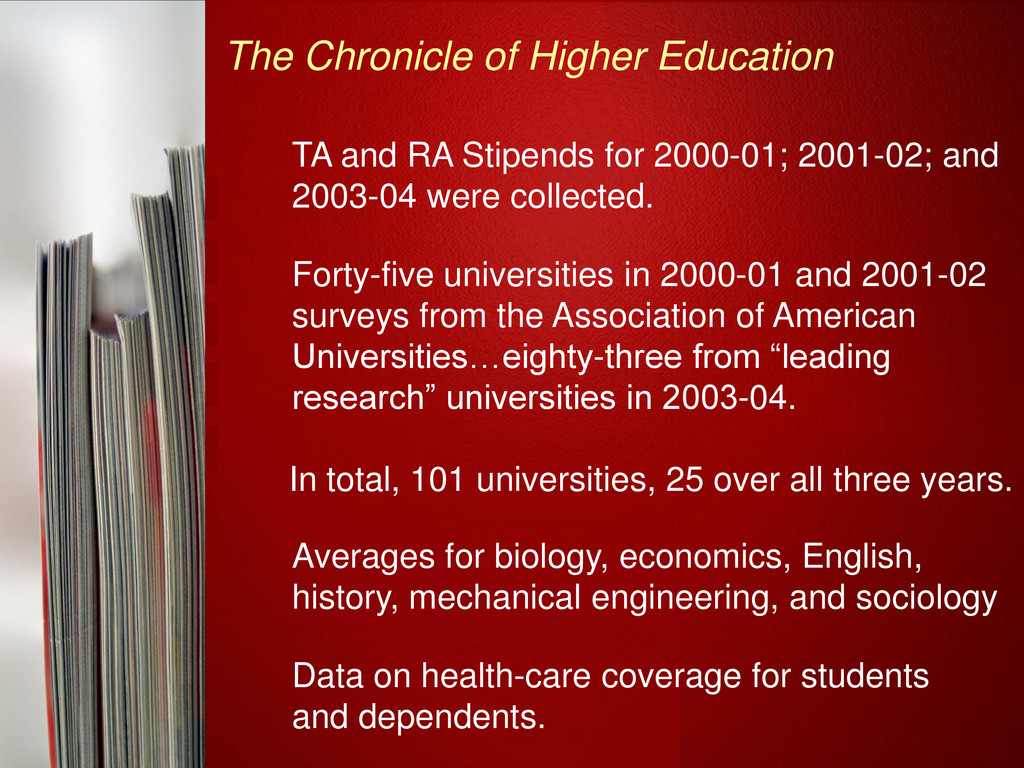
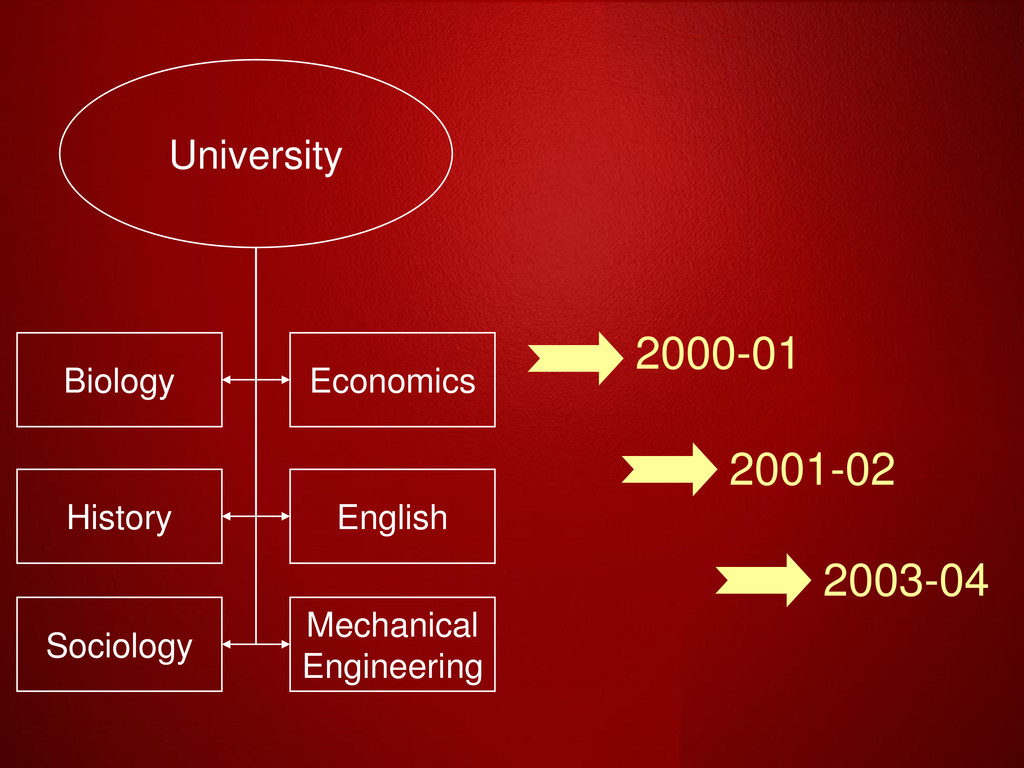
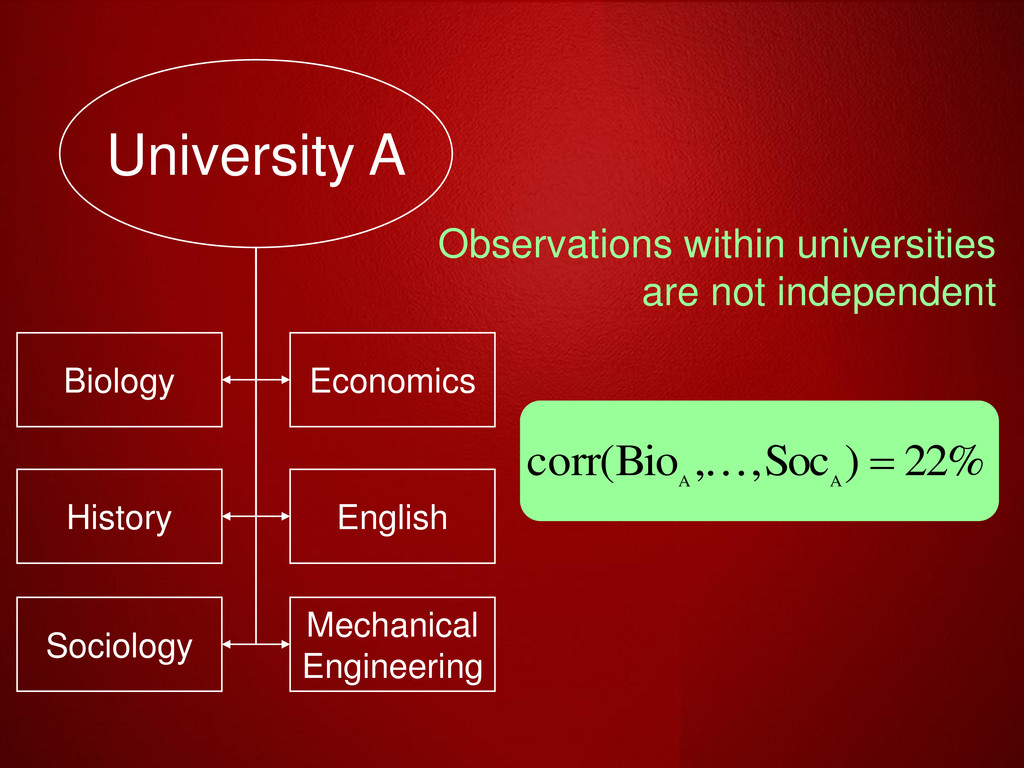
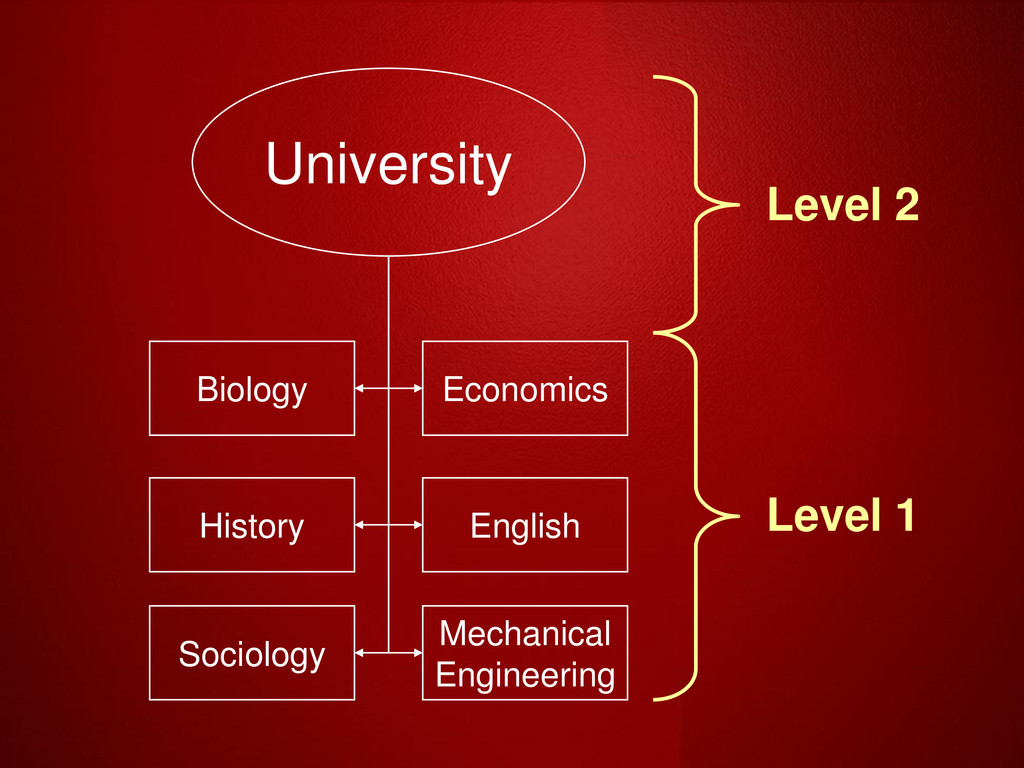
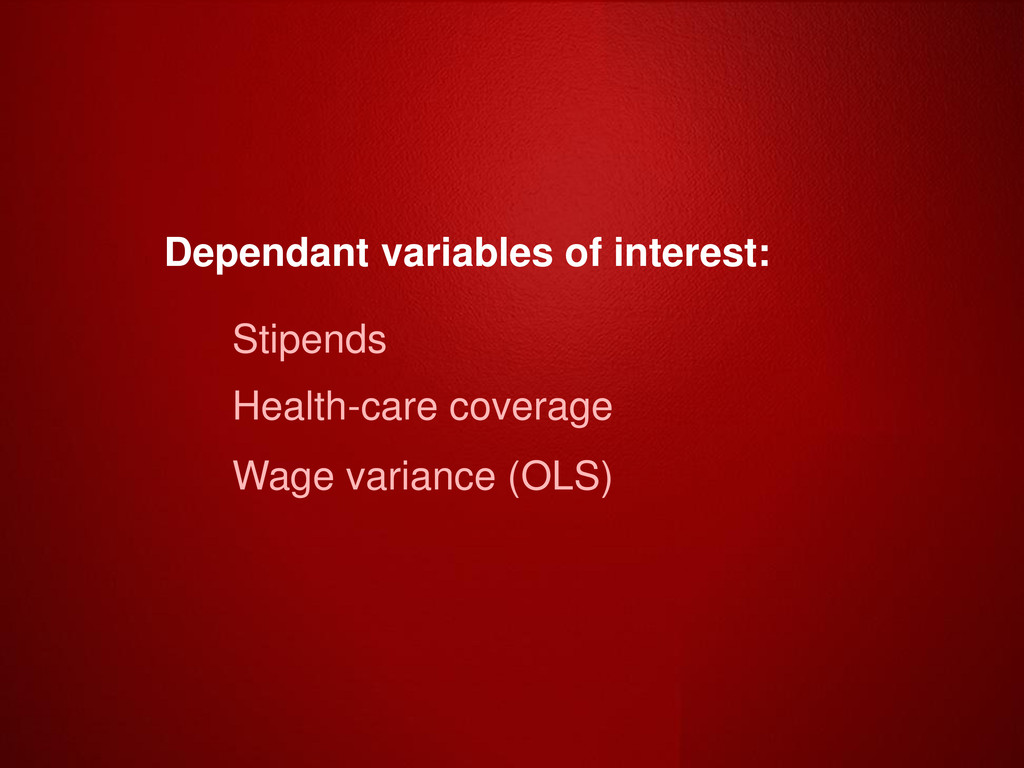
for 2000-01; 2001-02; and 2003-04 were collected. Forty-five universities in 2000-01 and 2001-02 surveys from the Association of American Universities…eighty-three from “leading research” universities in 2003-04. In total, 101 universities, 25 over all three years. Data on health-care coverage for students and dependents. Averages for biology, economics, English, history, mechanical engineering, and sociology
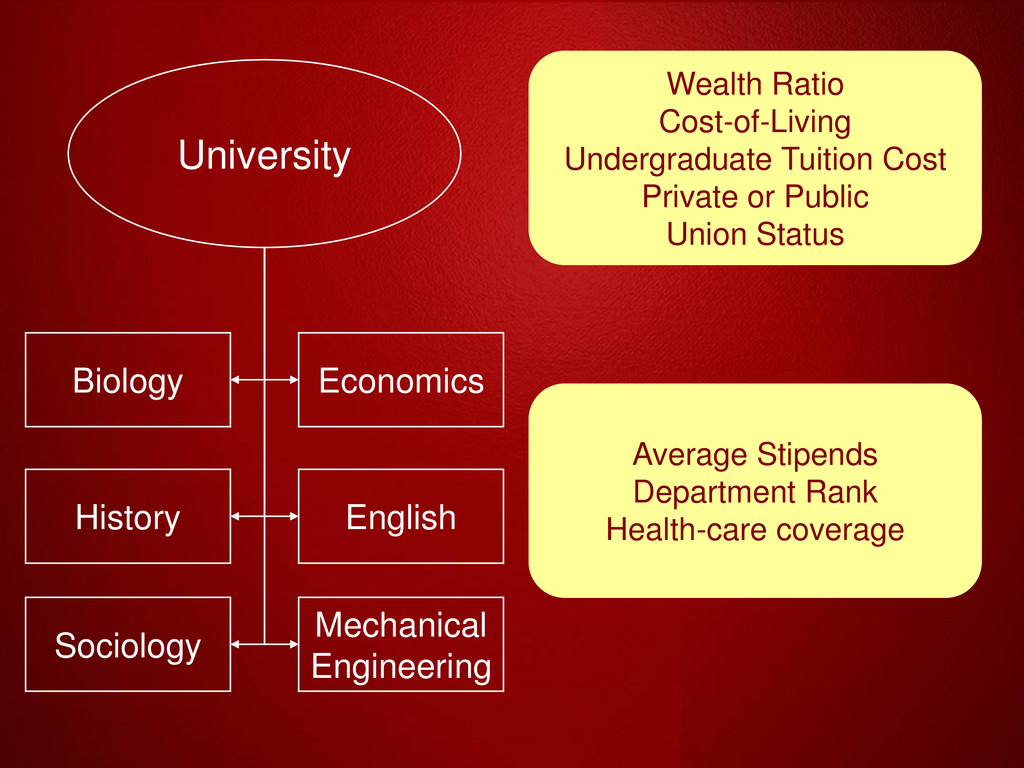
enrollment size; endowment; and cost-of-living. National Science Foundation Department ranks from 1995 Coalition of Graduate Employees & newspapers Union status
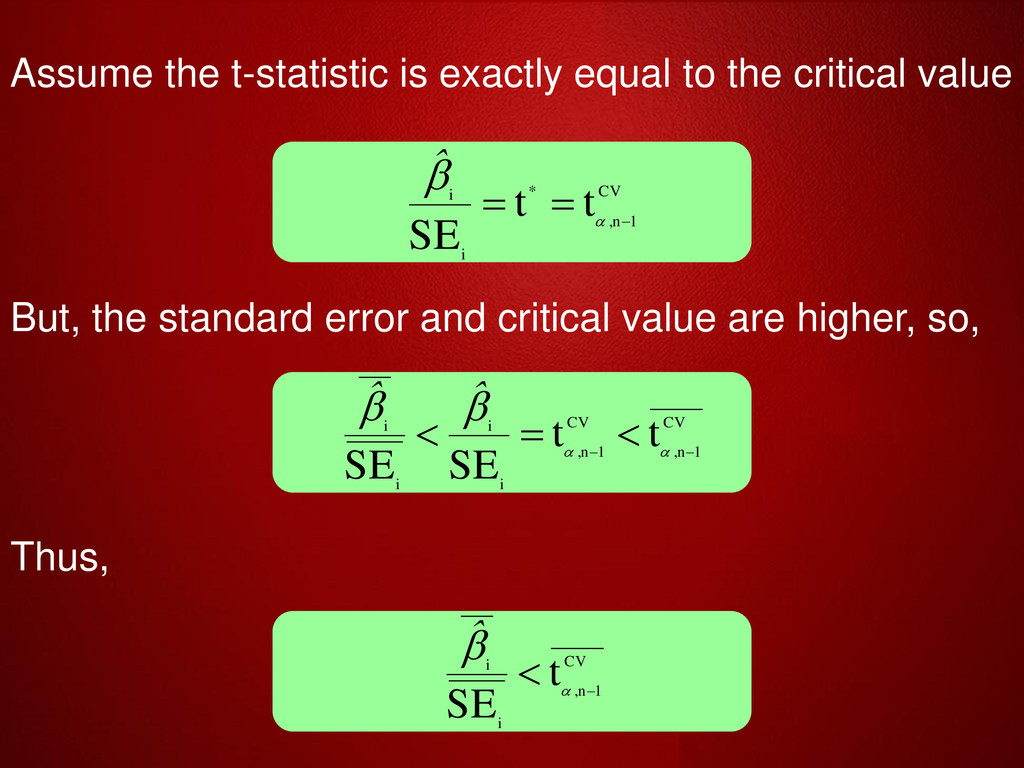
SE Assume the t-statistic is exactly equal to the critical value But, the standard error and critical value are higher, so, CV n , CV n , i i i i t t ˆ ˆ 1 1 SE SE Thus, CV n , i i t ˆ 1 SE
models. OLS w/ robust errors corrects the symptoms, but does not model the issue. Multilevel models are more ideal since they explicitly model two “levels” of data.
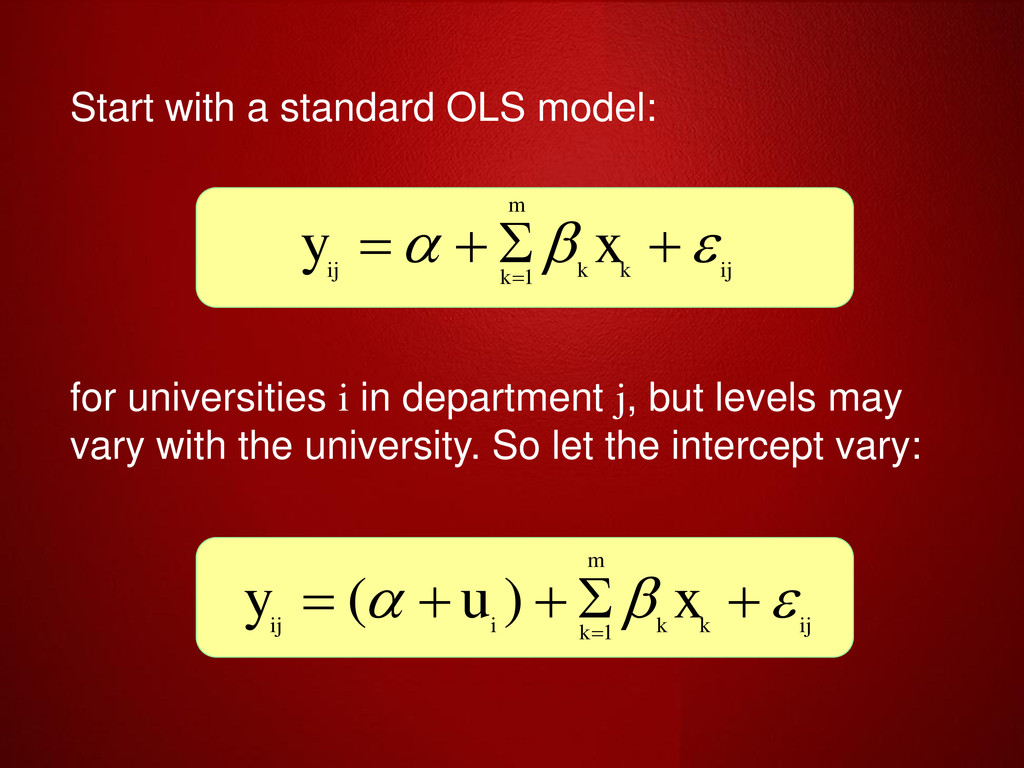
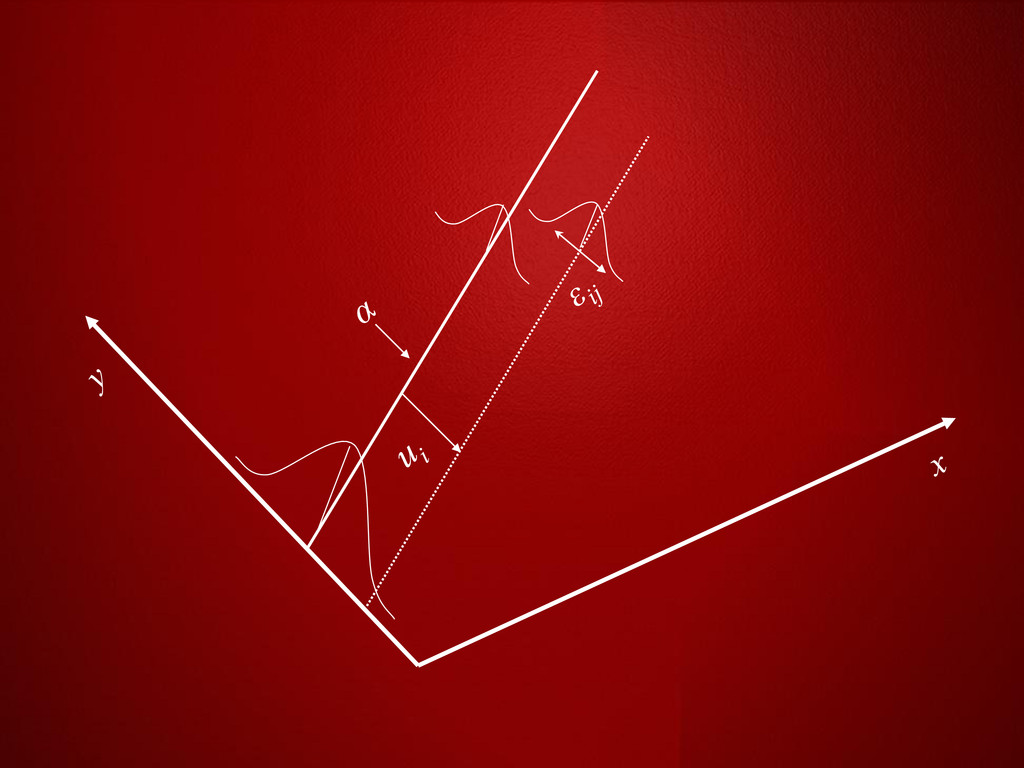
1 Start with a standard OLS model: for universities i in department j, but levels may vary with the university. So let the intercept vary: ij k k m k i ij x u y 1 ) (
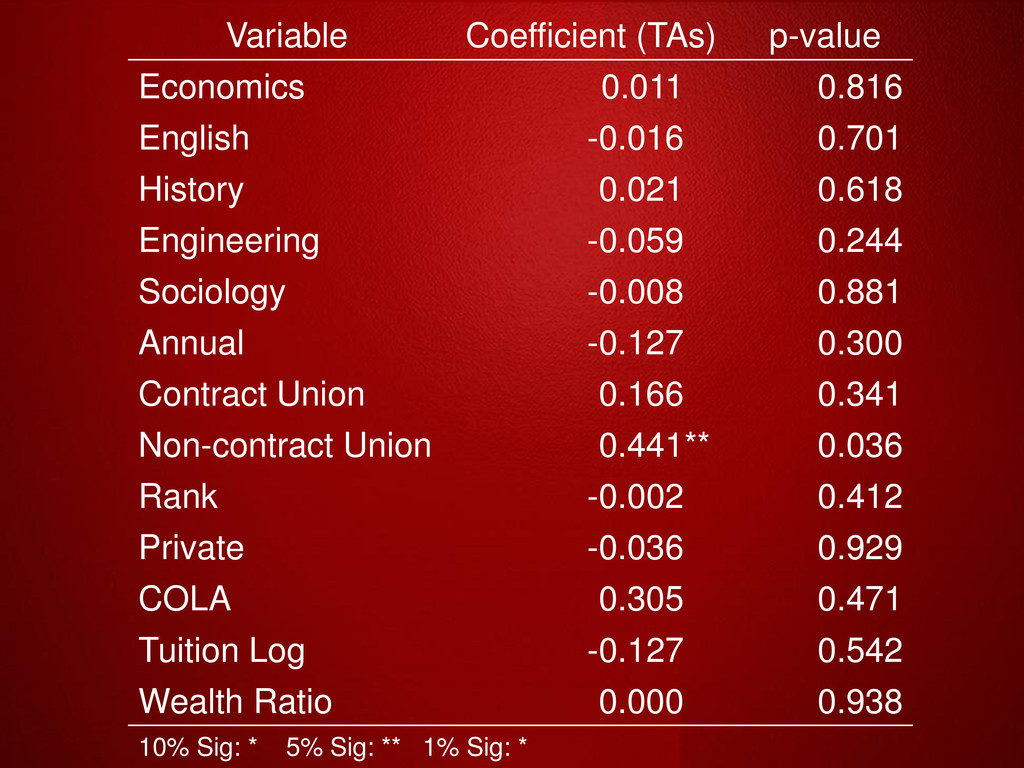
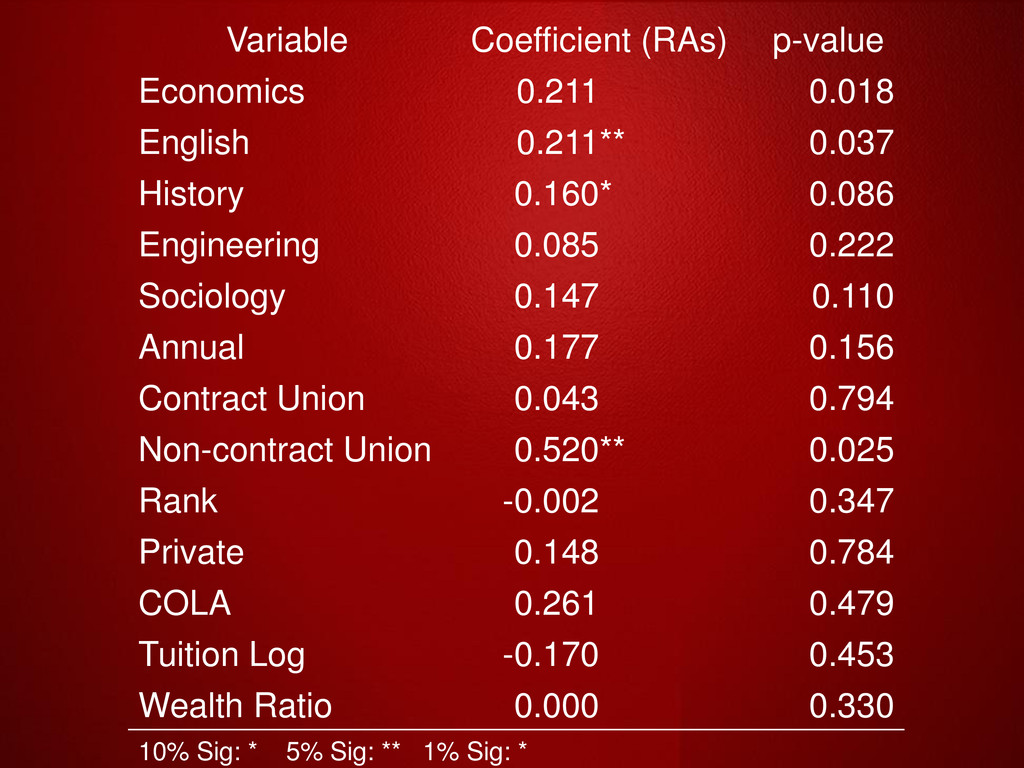
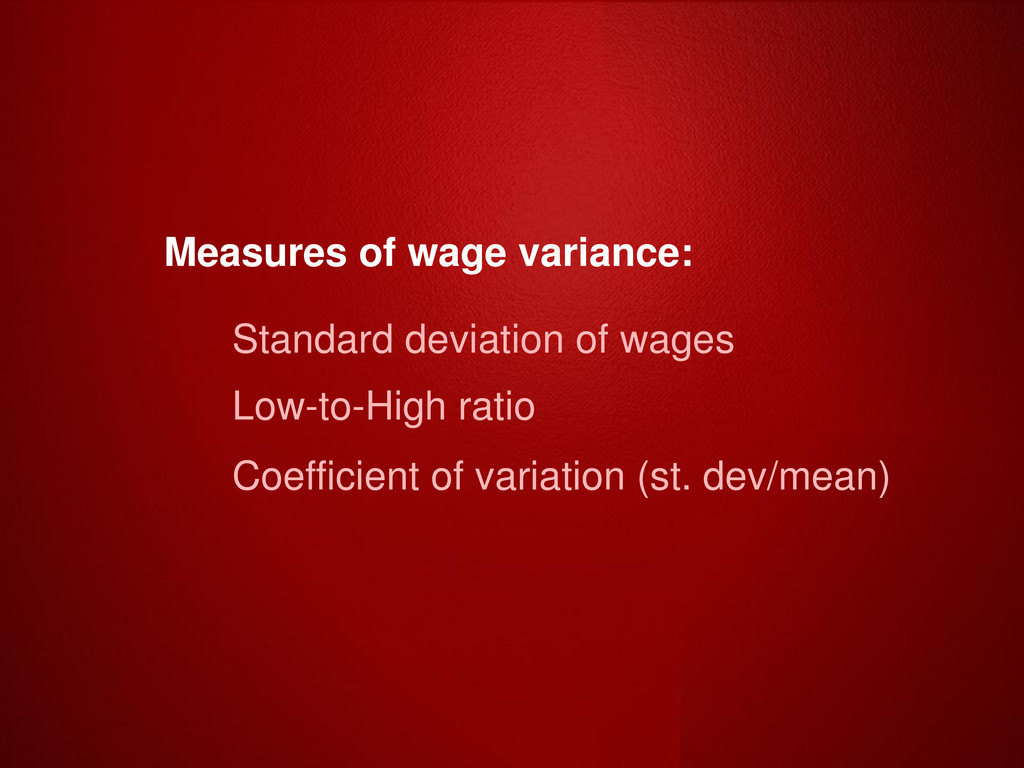
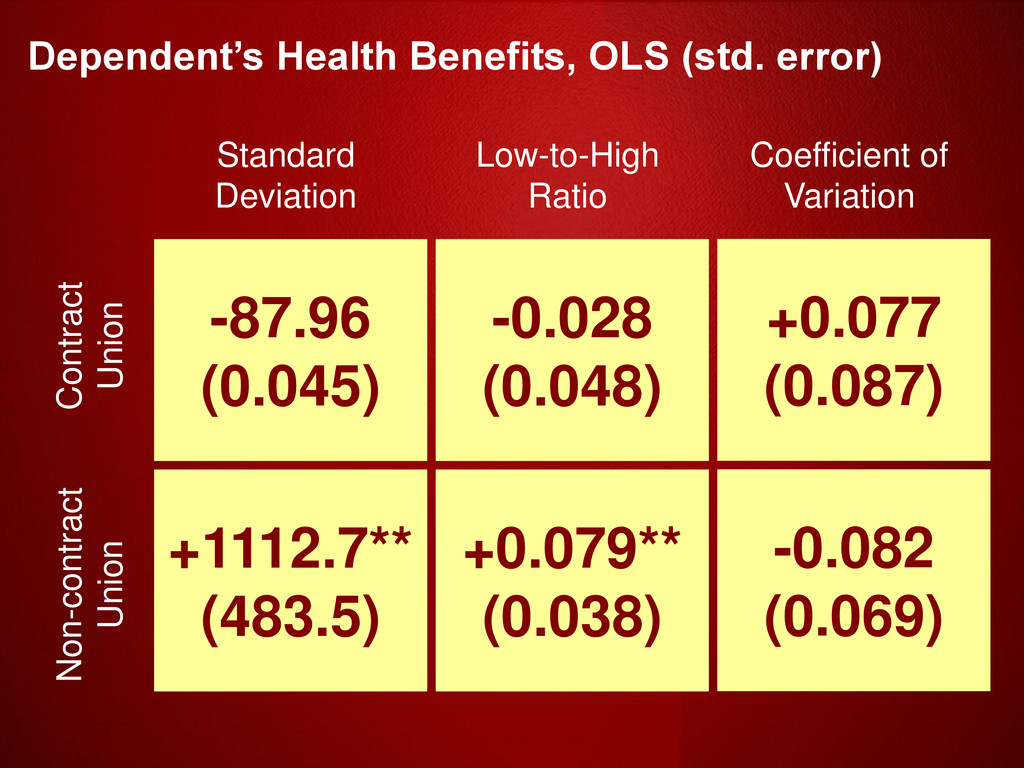
+0.079** (0.038) Standard Deviation Low-to-High Ratio Dependent’s Health Benefits, OLS (std. error) +0.077 (0.087) -0.082 (0.069) Coefficient of Variation