evaluation and communication of personal financial information. Practice- and application-oriented (Type A) Supervised by Prof. Dr. Gerhard Buurman and Dr. Karmen Franinović 2 Visual Instruments for Personal Finances
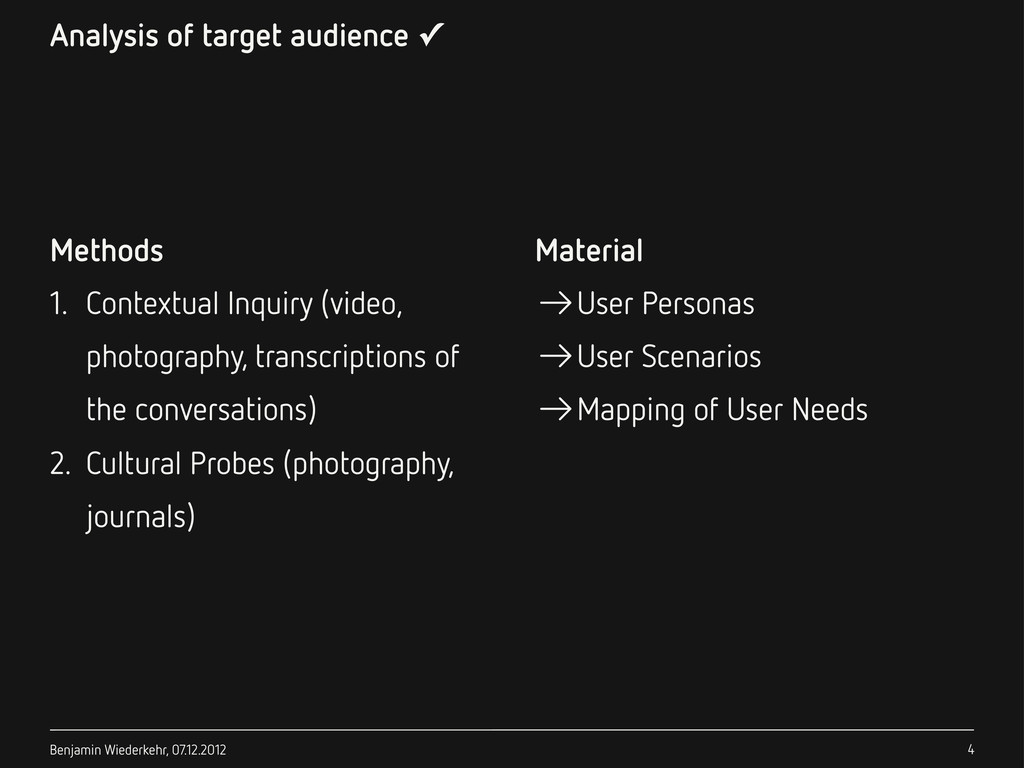
Contextual Inquiry (video, photography, transcriptions of the conversations) 2. Cultural Probes (photography, journals) Material →User Personas →User Scenarios →Mapping of User Needs 4
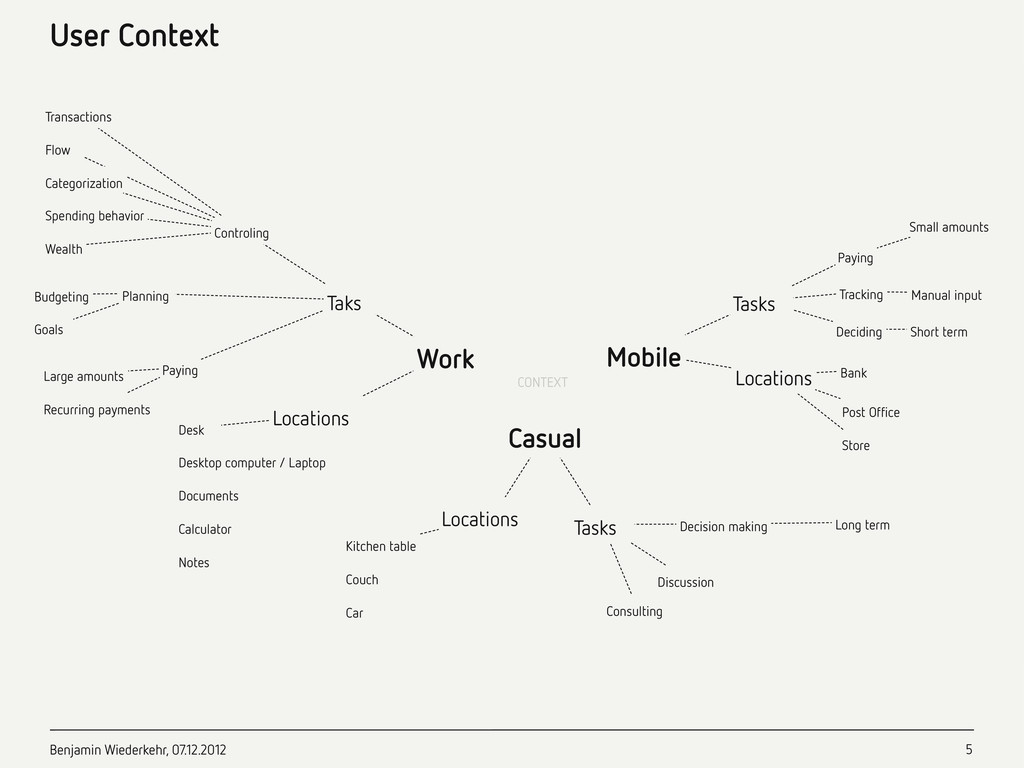
Small amounts Deciding Manual input Short term Tasks Decision making Long term Locations Desk Desktop computer / Laptop Documents Calculator Notes Discussion Consulting Locations Kitchen table Couch Car Budgeting Large amounts Locations Bank Post Office Store Recurring payments Goals Transactions Flow Categorization Spending behavior Wealth CONTEXT Benjamin Wiederkehr, 07.12.2012 User Context 5
Affinity Diagram 2. Expert Review Material →Collection and categorization →State of the art in research and industry →Discrepancy between demand and supply 7
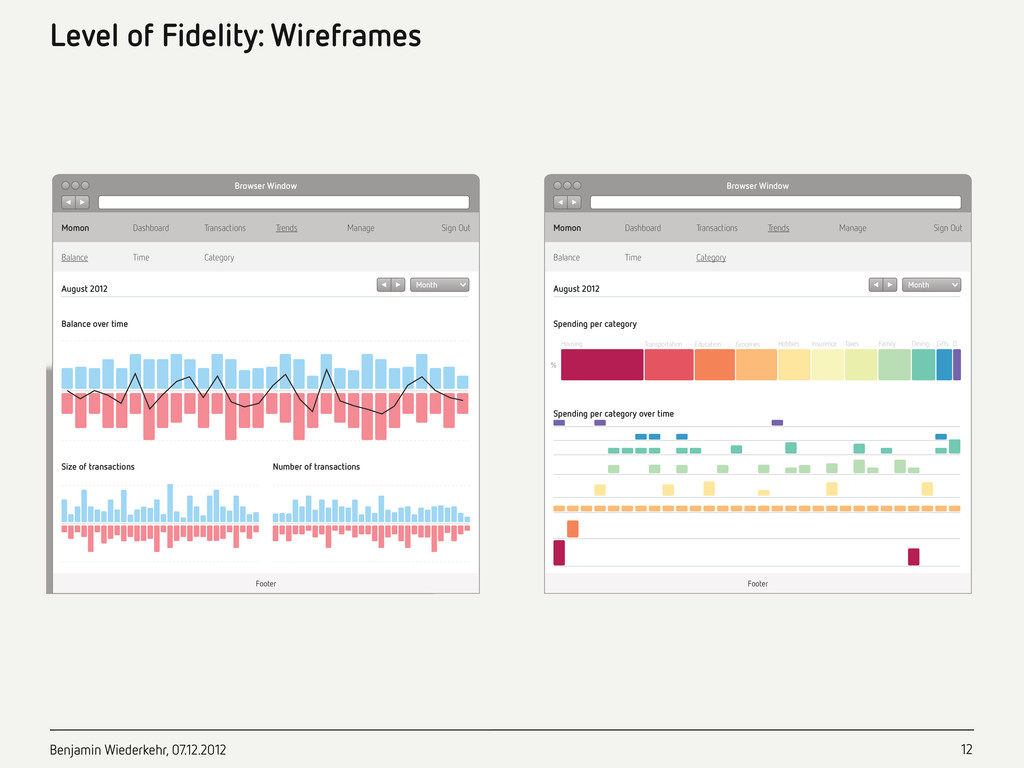
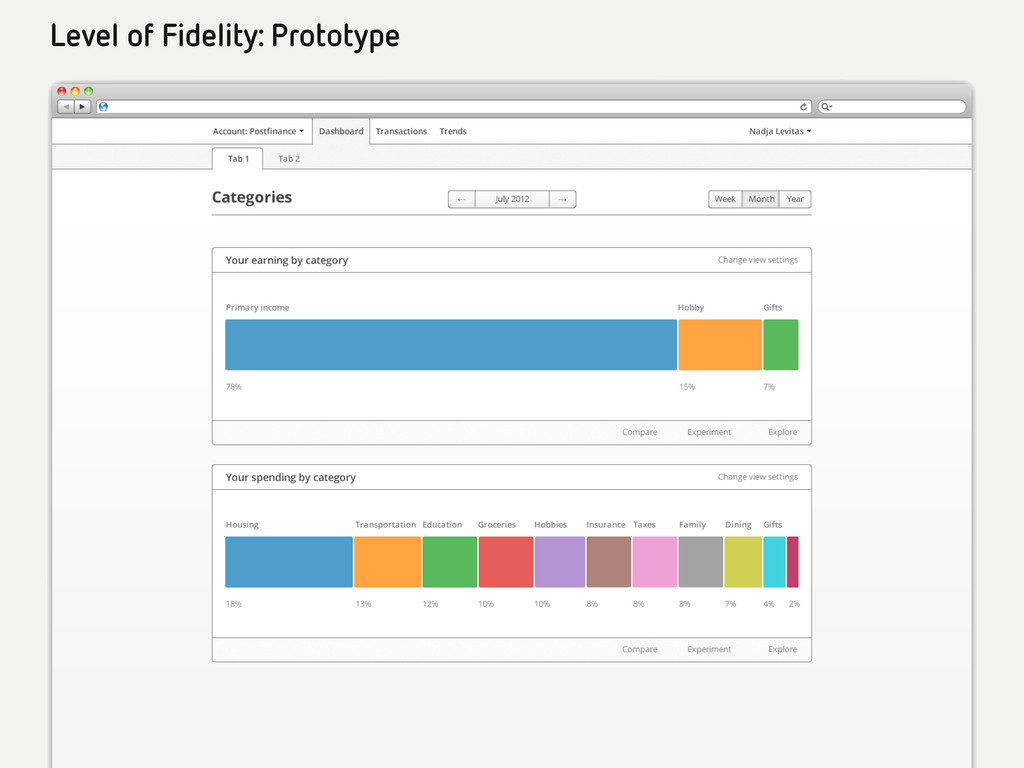
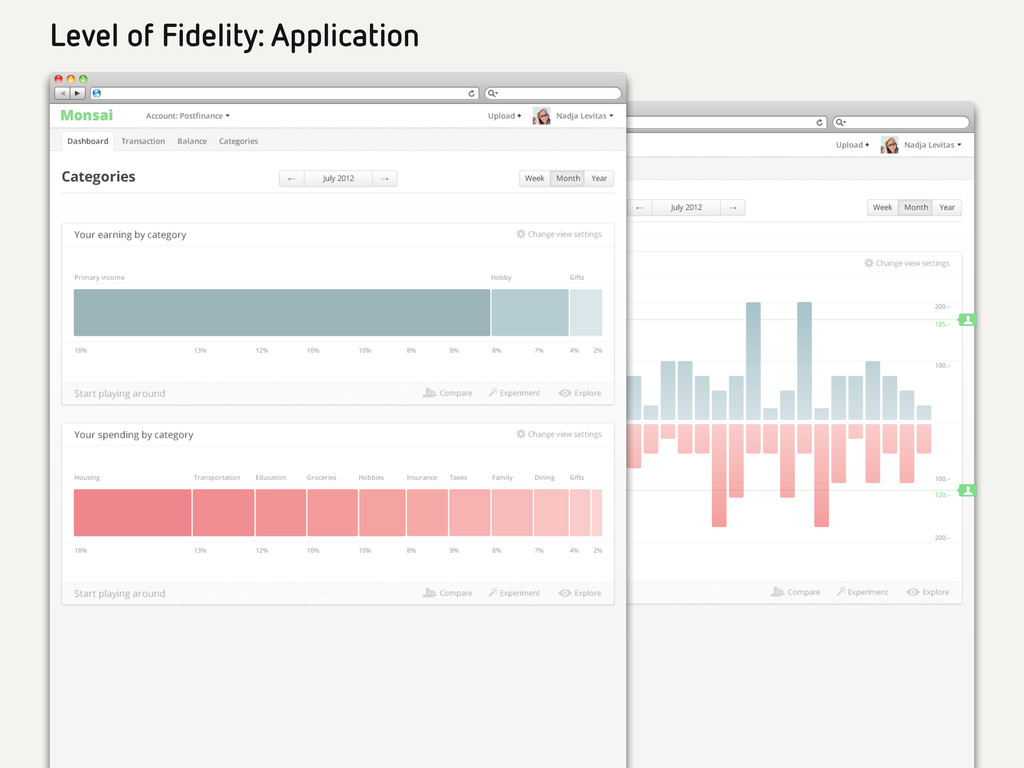
Momon Dashboard Transactions Trends Manage Sign Out Footer Balance Time Category August 2012 Balance over time Size of transactions Number of transactions Month Browser Window Momon Dashboard Transactions Trends Manage Sign Out Footer Balance Time Category August 2012 Spending per category Month % Housing Transportation Education Groceries Hobbies Insurence Taxes Family Dining Gifts O Spending per category over time
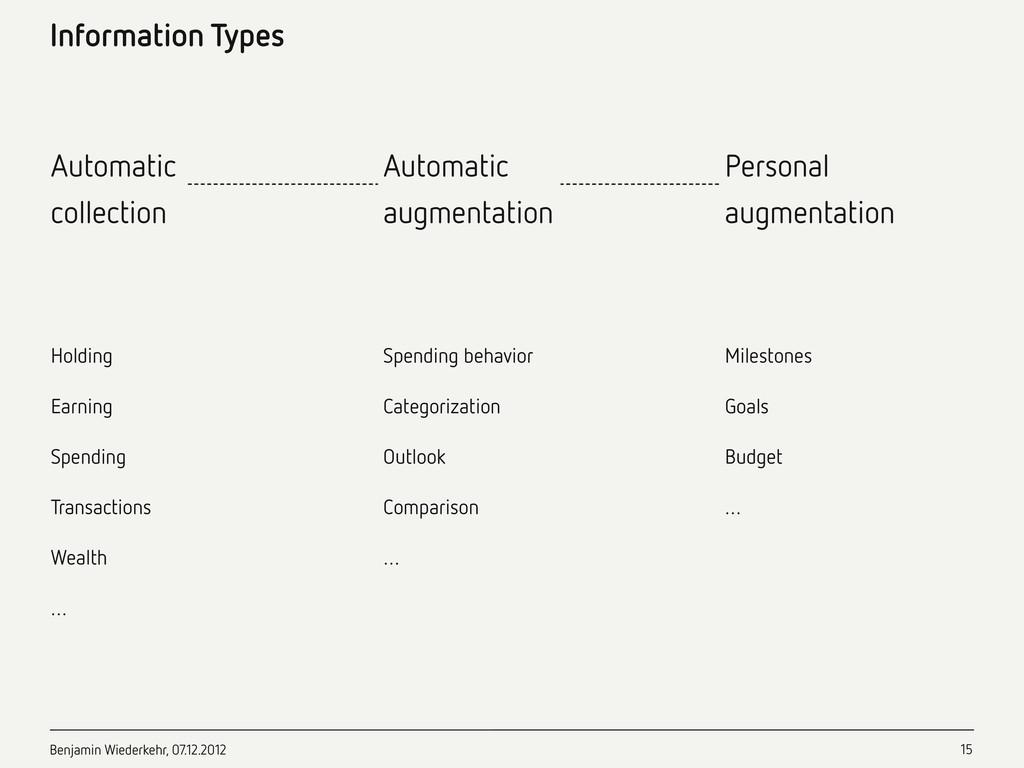
Holding Milestones Automatic collection Automatic augmentation Personal augmentation Outlook Comparison … … … Benjamin Wiederkehr, 07.12.2012 Information Types 15
reasoning Study if and how a visualization tool supports users in generating actionable and relevant knowledge in their domain. In general, VDAR evaluation requires fairly well developed and reliable software. 17 H. Lam, E. Bertini, P. Isenberg, C. Plaisant, and S. Carpendale, “Empirical Studies in Information Visualization: Seven Scenarios,” Visualization and Computer Graphics, IEEE Transactions on, vol. 18, no. 9, pp. 1520–1536, 2012.
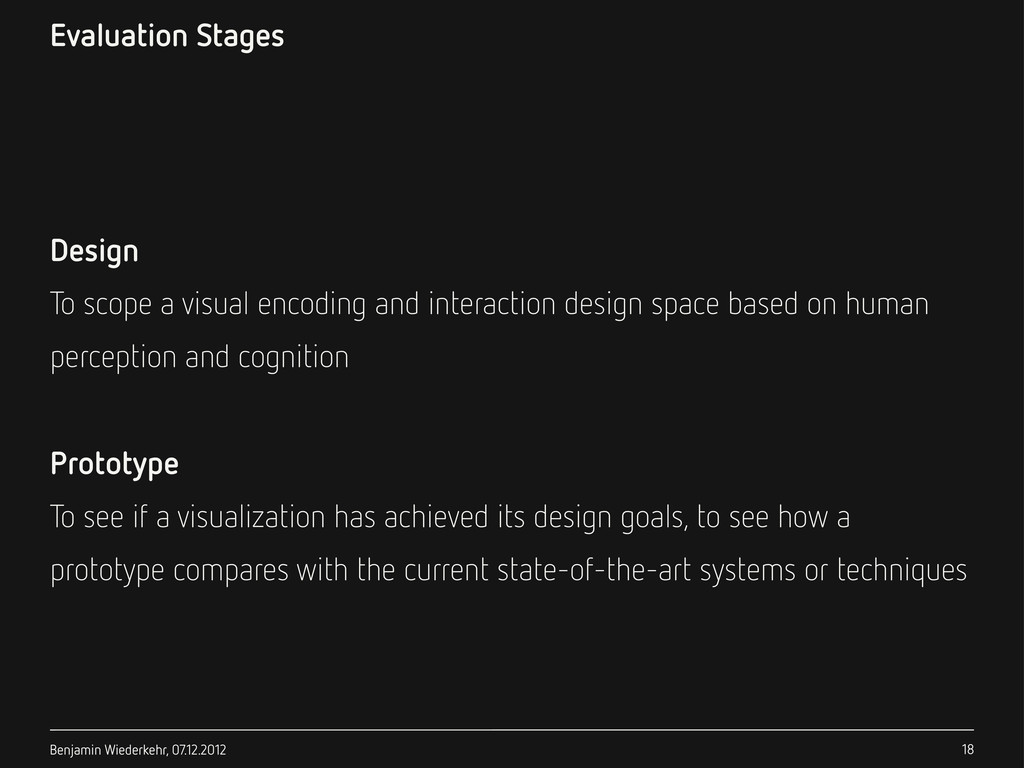
encoding and interaction design space based on human perception and cognition Prototype To see if a visualization has achieved its design goals, to see how a prototype compares with the current state-of-the-art systems or techniques 18
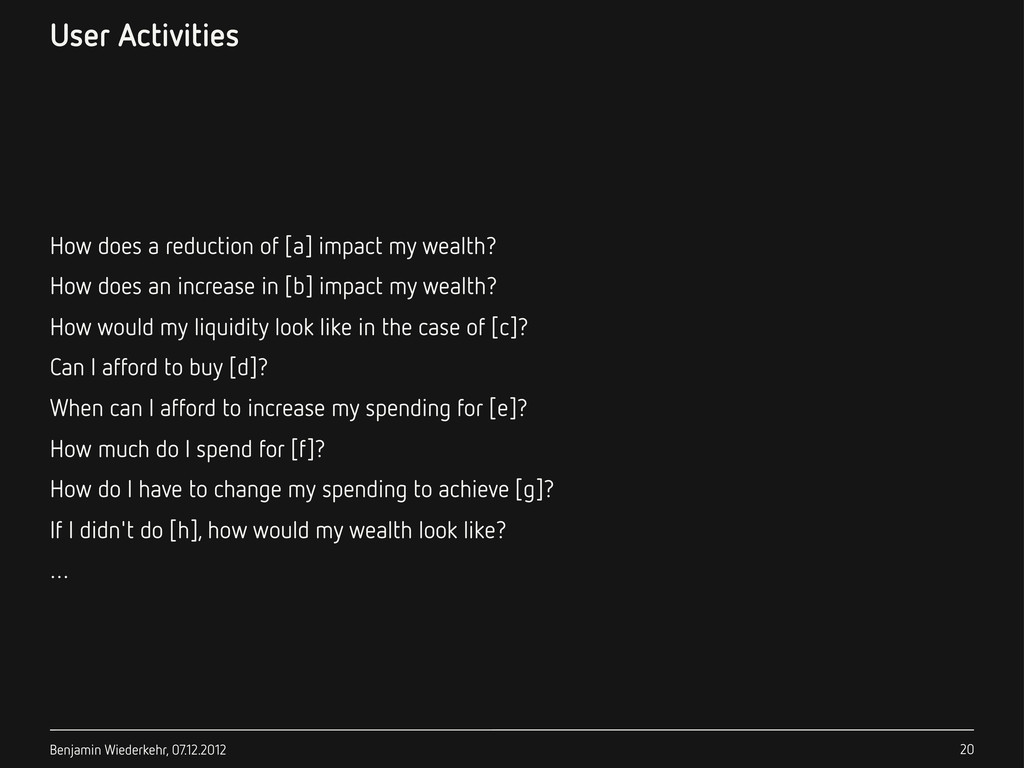
[a] impact my wealth? How does an increase in [b] impact my wealth? How would my liquidity look like in the case of [c]? Can I afford to buy [d]? When can I afford to increase my spending for [e]? How much do I spend for [f]? How do I have to change my spending to achieve [g]? If I didn't do [h], how would my wealth look like? … 20
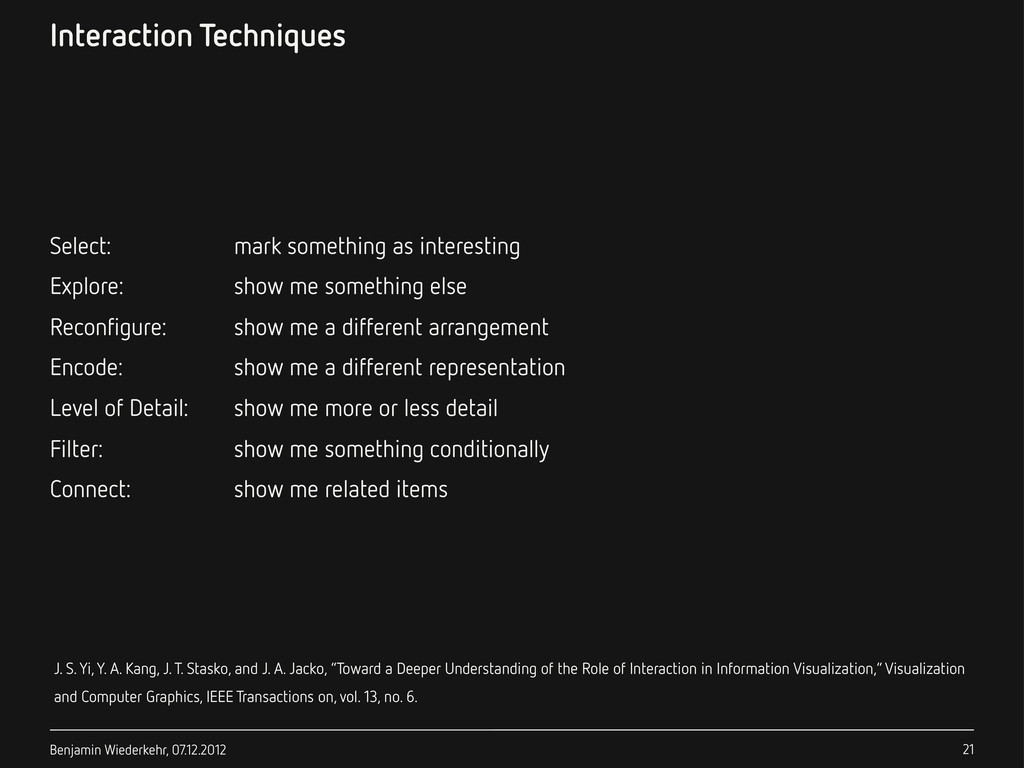
Explore: show me something else Reconfigure: show me a different arrangement Encode: show me a different representation Level of Detail: show me more or less detail Filter: show me something conditionally Connect: show me related items 21 J. S. Yi, Y. A. Kang, J. T. Stasko, and J. A. Jacko, “Toward a Deeper Understanding of the Role of Interaction in Information Visualization,” Visualization and Computer Graphics, IEEE Transactions on, vol. 13, no. 6.
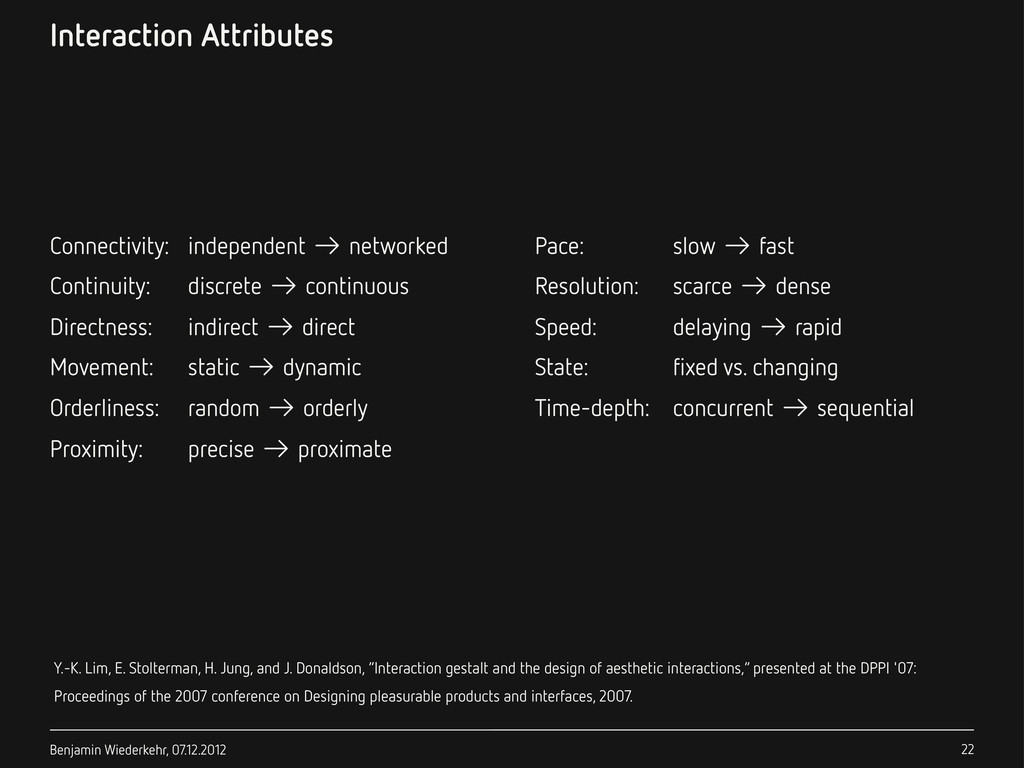
discrete → continuous Directness: indirect → direct Movement: static → dynamic Orderliness: random → orderly Proximity: precise → proximate Pace: slow → fast Resolution: scarce → dense Speed: delaying → rapid State: fixed vs. changing Time-depth: concurrent → sequential 22 Y.-K. Lim, E. Stolterman, H. Jung, and J. Donaldson, “Interaction gestalt and the design of aesthetic interactions,” presented at the DPPI '07: Proceedings of the 2007 conference on Designing pleasurable products and interfaces, 2007.
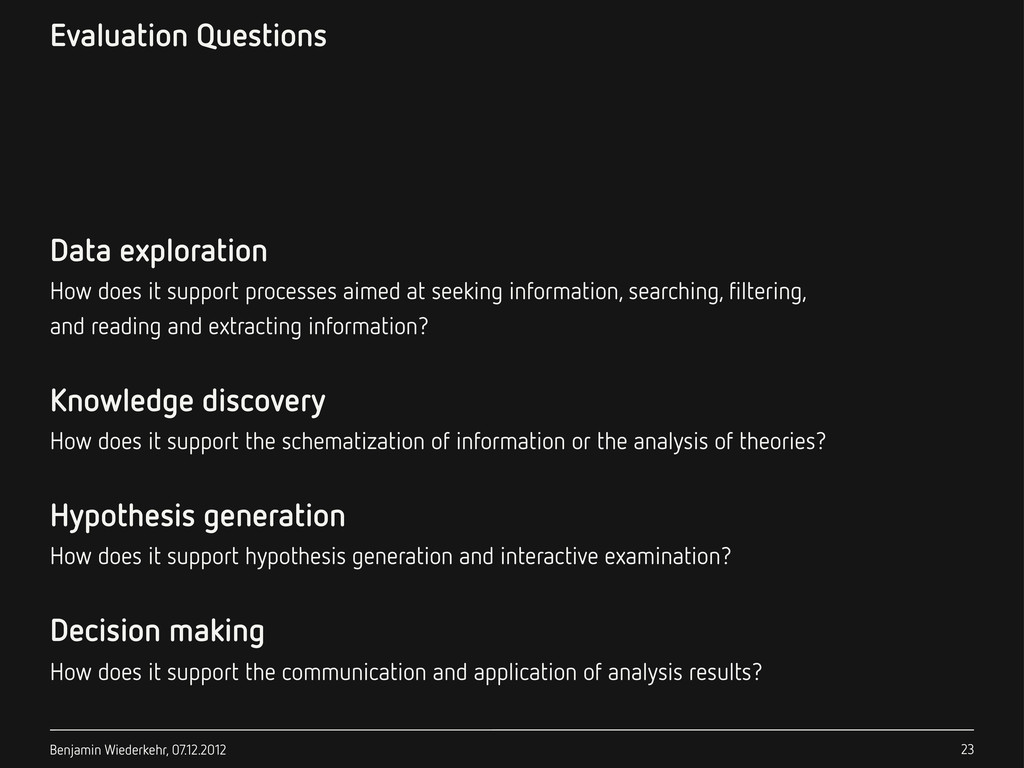
support processes aimed at seeking information, searching, filtering, and reading and extracting information? Knowledge discovery How does it support the schematization of information or the analysis of theories? Hypothesis generation How does it support hypothesis generation and interactive examination? Decision making How does it support the communication and application of analysis results? 23
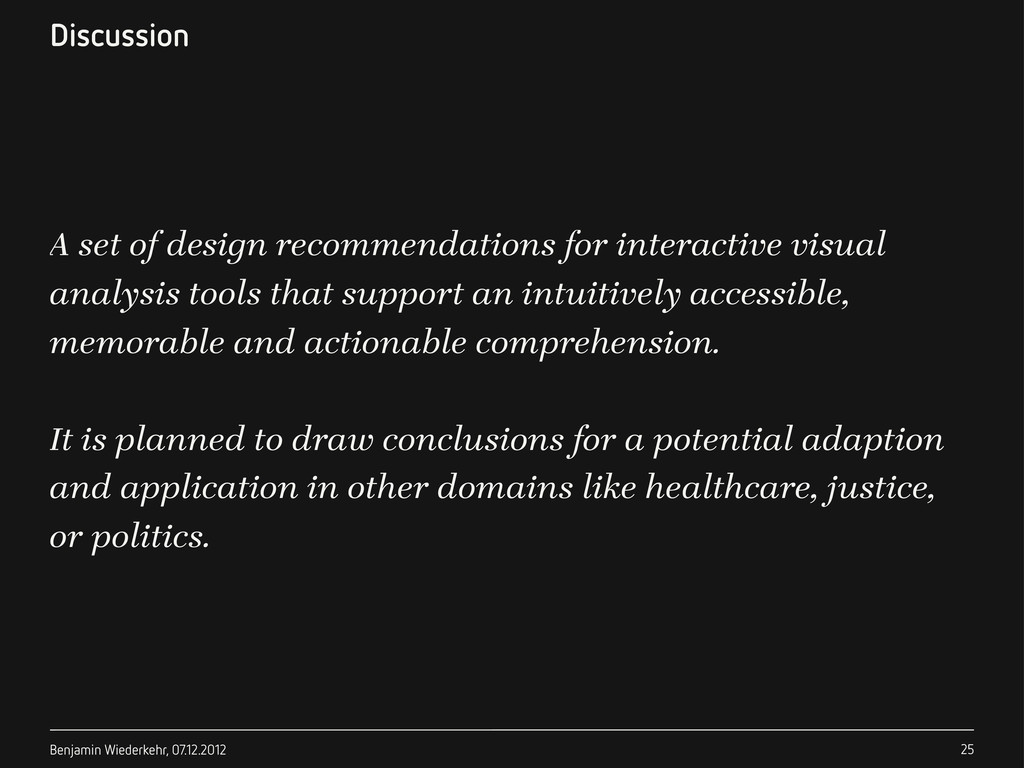
interactive visual analysis tools that support an intuitively accessible, memorable and actionable comprehension. It is planned to draw conclusions for a potential adaption and application in other domains like healthcare, justice, or politics. 25
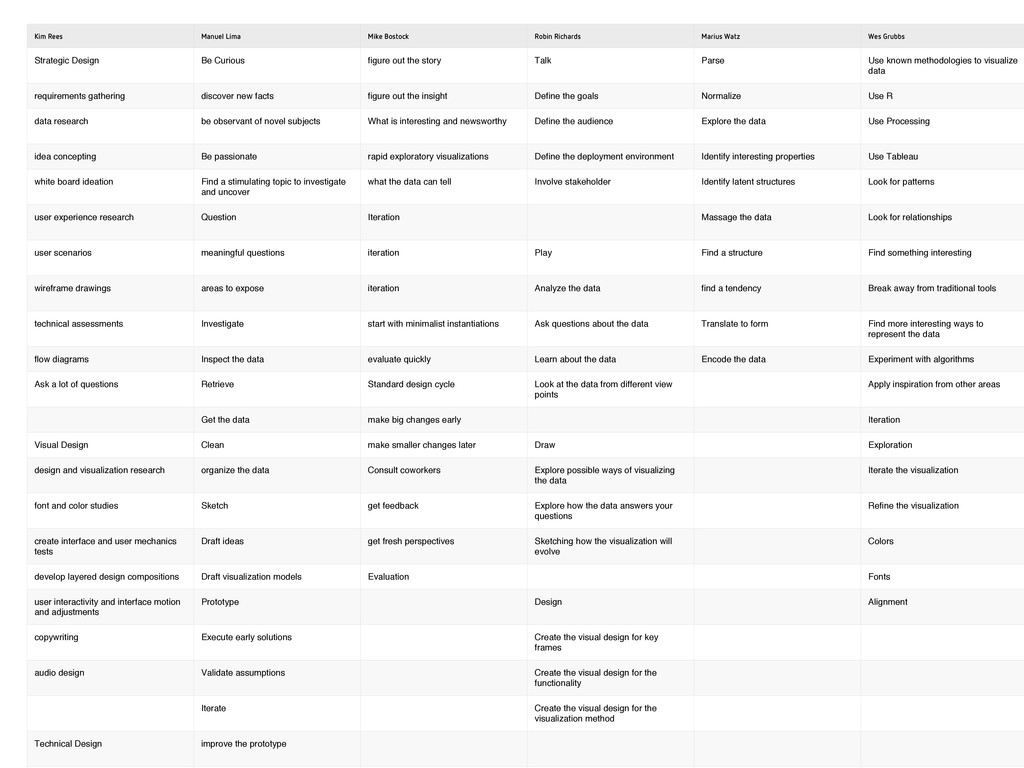
Wes Grubbs Strategic Design Be Curious figure out the story Talk Parse Use known methodologies to visualize data requirements gathering discover new facts figure out the insight Define the goals Normalize Use R data research be observant of novel subjects What is interesting and newsworthy Define the audience Explore the data Use Processing idea concepting Be passionate rapid exploratory visualizations Define the deployment environment Identify interesting properties Use Tableau white board ideation Find a stimulating topic to investigate and uncover what the data can tell Involve stakeholder Identify latent structures Look for patterns user experience research Question Iteration Massage the data Look for relationships user scenarios meaningful questions iteration Play Find a structure Find something interesting wireframe drawings areas to expose iteration Analyze the data find a tendency Break away from traditional tools technical assessments Investigate start with minimalist instantiations Ask questions about the data Translate to form Find more interesting ways to represent the data flow diagrams Inspect the data evaluate quickly Learn about the data Encode the data Experiment with algorithms Ask a lot of questions Retrieve Standard design cycle Look at the data from different view points Apply inspiration from other areas Get the data make big changes early Iteration Visual Design Clean make smaller changes later Draw Exploration design and visualization research organize the data Consult coworkers Explore possible ways of visualizing the data Iterate the visualization font and color studies Sketch get feedback Explore how the data answers your questions Refine the visualization create interface and user mechanics tests Draft ideas get fresh perspectives Sketching how the visualization will evolve Colors develop layered design compositions Draft visualization models Evaluation Fonts user interactivity and interface motion and adjustments Prototype Design Alignment copywriting Execute early solutions Create the visual design for key frames audio design Validate assumptions Create the visual design for the functionality Iterate Create the visual design for the visualization method Technical Design improve the prototype
Marius Watz Wes Grubbs Sha Hwang Deroy Pereza Gregor Aisch Stefanie Posavec Moritz Stef Strategic Design Talk Define so goals requirements gathering Define the goals Talk abo Define the audience Talk abo Define the deployment environment Talk abo Involve stakeholder Identify the data set Retrieve Gathering Data Get the data Counting all the words one by one Data in r Get the data Gather additional research from new sources Clean Parse clean the data organize the data Normalize Have the data ready Sorting them by key themes data research Analyze the data Explore the data Spot holes in the data Explore it Ask questions about the data Interviewing the data Facts support the story Learn about the data Ask questions Fact checking Know the data set Get a gri Look at the data from different view points Who When Where What Understa idea concepting Sketch Draw Getting i Draft ideas Explore possible ways of visualizing the data Use known methodologies to visualize data Different sketches Vague ideas Sketch p data Use R Different Views on the data Do visualization attempts Do explo Use Processing Ask questions visually Produce Use Tableau Get a se Draft visualization models Sketching how the visualization will evolve Testing ideas out visually Explore how the data answers your questions white board ideation Sketch thumbnail sketches Make the graphics in Illustrator user experience research user scenarios wireframe drawings Test out composition ideas Creating A Hierarchy technical assessments Solidify the hierarchical structure flow diagrams Building A Wireframe Ask a lot of questions Be Curious Create a wireframe Question Ask questions of the sketches meaningful questions discover new facts Find a stimulating topic to investigate and uncover Start with a unique intent Feel personally attached to a data set Create bonds with what you are working on be observant of novel subjects Clarifying a complex set of data areas to expose Explaining a process Supporting an argument Investigate Highlighting a trend Inspect the data Look for patterns Look for relationships figure out the story Finding The Narrative Find a story worth publishing Highlight figure out the insight Distributions are more interesting than averages Identify interesting properties Find something interesting Find the story Identify latent structures Finding a great narrative Find a structure Identifying Problems Identify the problem find a tendency Reality check What is interesting and newsworthy Mood board of research points what the data can tell Collaborative reworking of the story and the data Massage the data Discovering more accurate narratives
some high level contents and goals Talk about goals Start with a unique intent Clarifying a complex set of data Explaining a process Supporting an argument Highlighting a trend Define the audience Define audience Define the deployment environment Define technical constraints Define timing Involve stakeholder Talk about challenges Talk about strategies Strategic Design requirements gathering Define the requirements Translate requirements into things I know how to do Prepare Identify the data set Retrieve Data in raw form Have the data ready Counting all the words one by one Acquisition of data sets Get the data Gathering Data Gather additional research from new sources Get the data Clean Spot holes in the data clean the data Data cleaning, reformatting, fixing, calculating organize the data Sorting them by key themes Arrange data Parse Normalize Massage the data data mining Explore data research Explore the data Explore it Exploration of the data set Analyze the data Data analysis Investigate Inspect the data Ask questions about the data Interviewing the data Ask questions Who When Where What Learn about the data Get a grip on the data Know the data set Understand the data Understand the data Getting in touch with the data Get a sense of the texture of the data Discover Fact checking Look at the data from different view points Finding a tweak Feel personally attached to a data set Create bonds with what you are working on Facts support the story Puzzle solving Look for patterns Look for relationships Find something interesting Find a stimulating topic to investigate and uncover be observant of novel subjects areas to expose What is interesting and newsworthy what the data can tell Distributions are more interesting than averages
audience Define the deployment environment Define technical constraints Define timing Involve stakeholder Define challenges Define strategies Strategic Design Define the requirements Translate requirements into things I know how to do Competitive landscape Technical assessment User Experience research User scenarios Technical assessments Design and visualization research
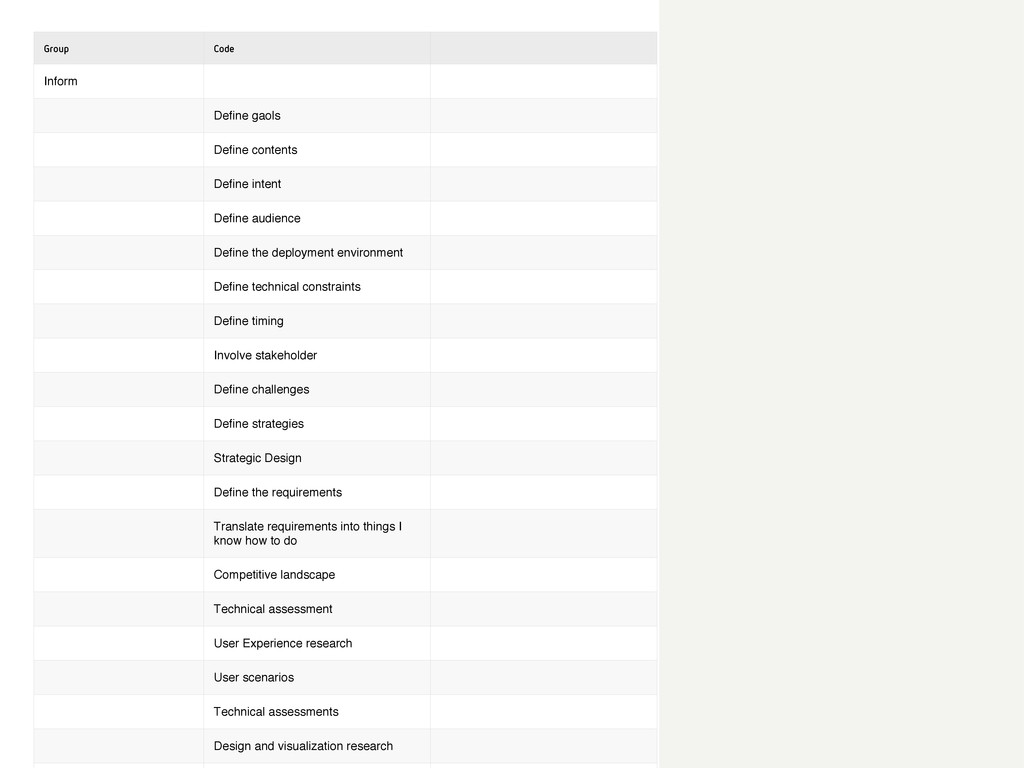
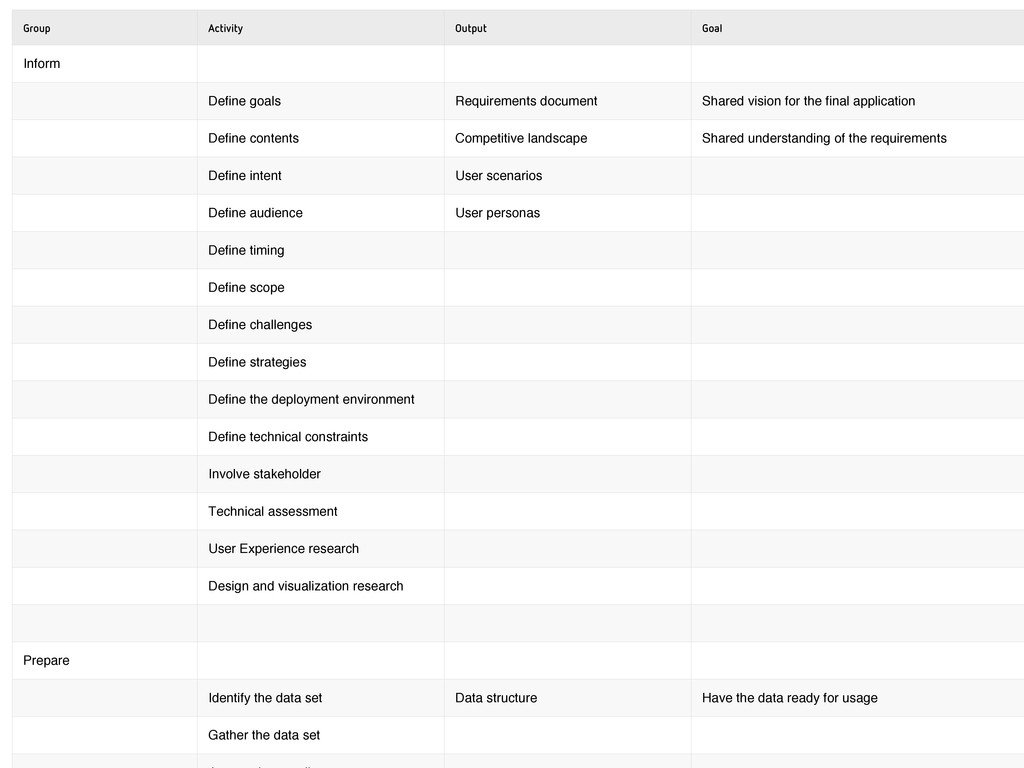
vision for the final application Define contents Competitive landscape Shared understanding of the requirements Define intent User scenarios Define audience User personas Define timing Define scope Define challenges Define strategies Define the deployment environment Define technical constraints Involve stakeholder Technical assessment User Experience research Design and visualization research Prepare Identify the data set Data structure Have the data ready for usage Gather the data set
experiments with the test environment Evaluation and iteration of the prototypes and the test environment Evaluation Identify the design principles Formulate how to apply them 30