Upgrade to Pro — share decks privately, control downloads, hide ads and more …

Video Business

Video Business

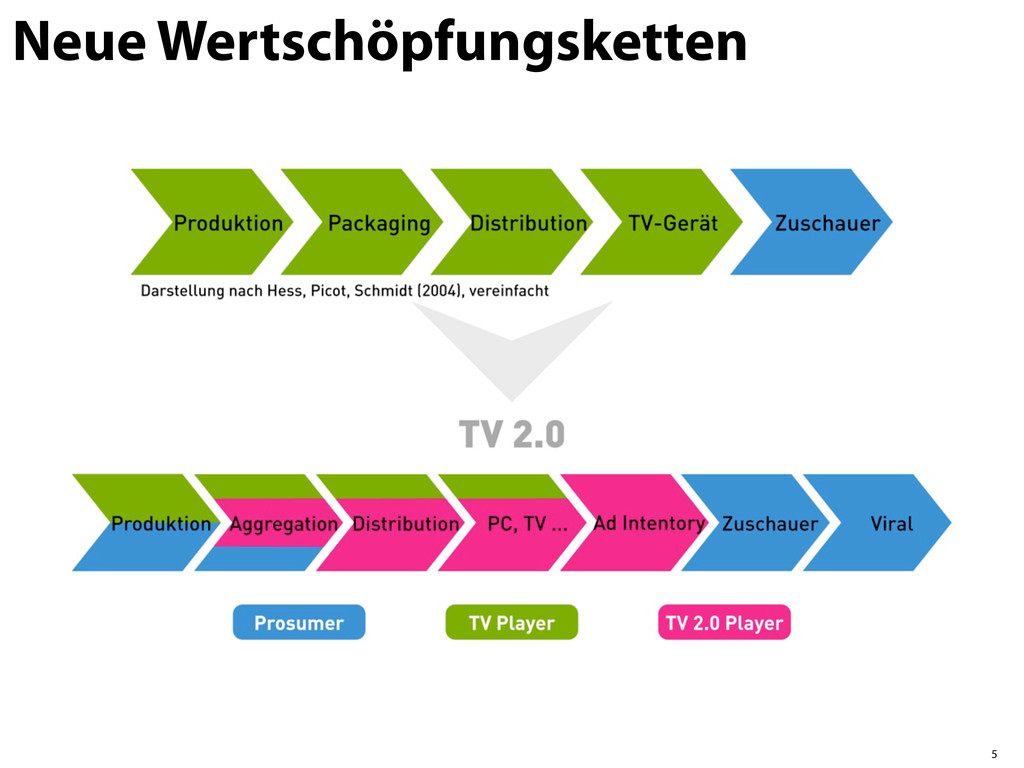
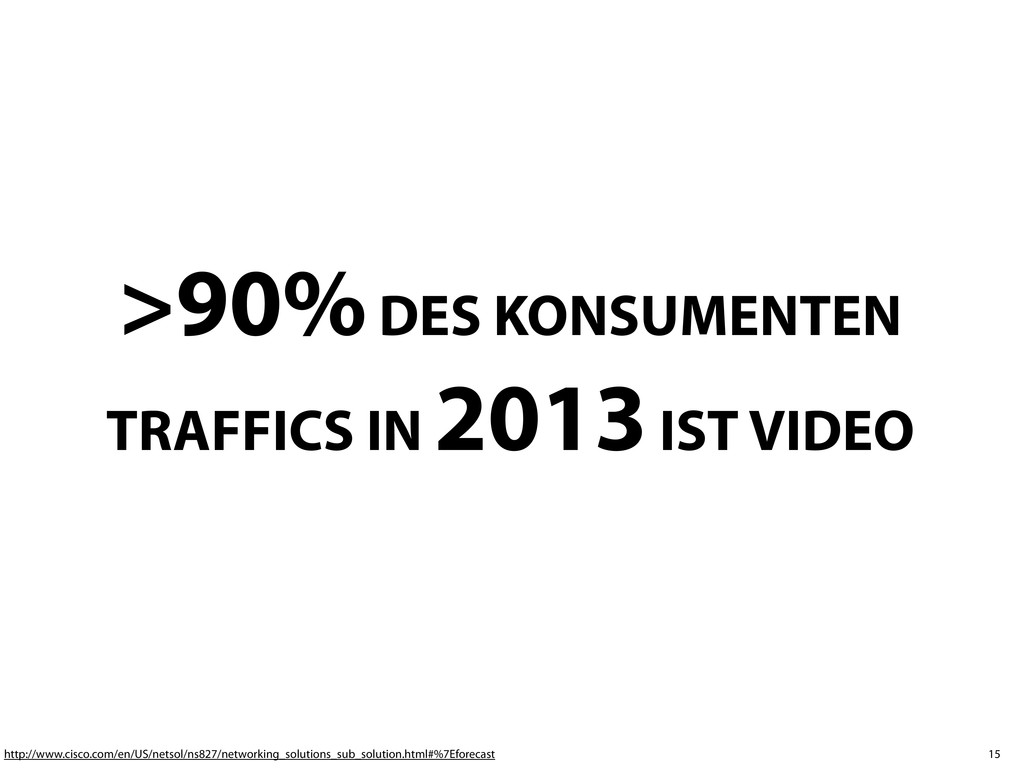
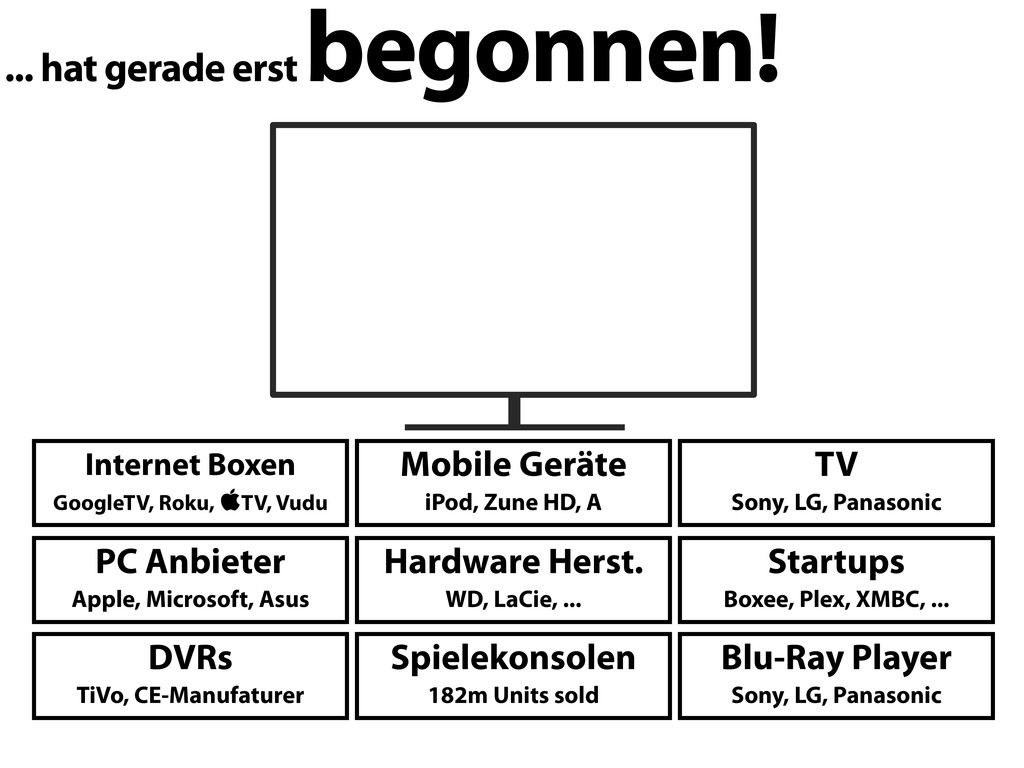
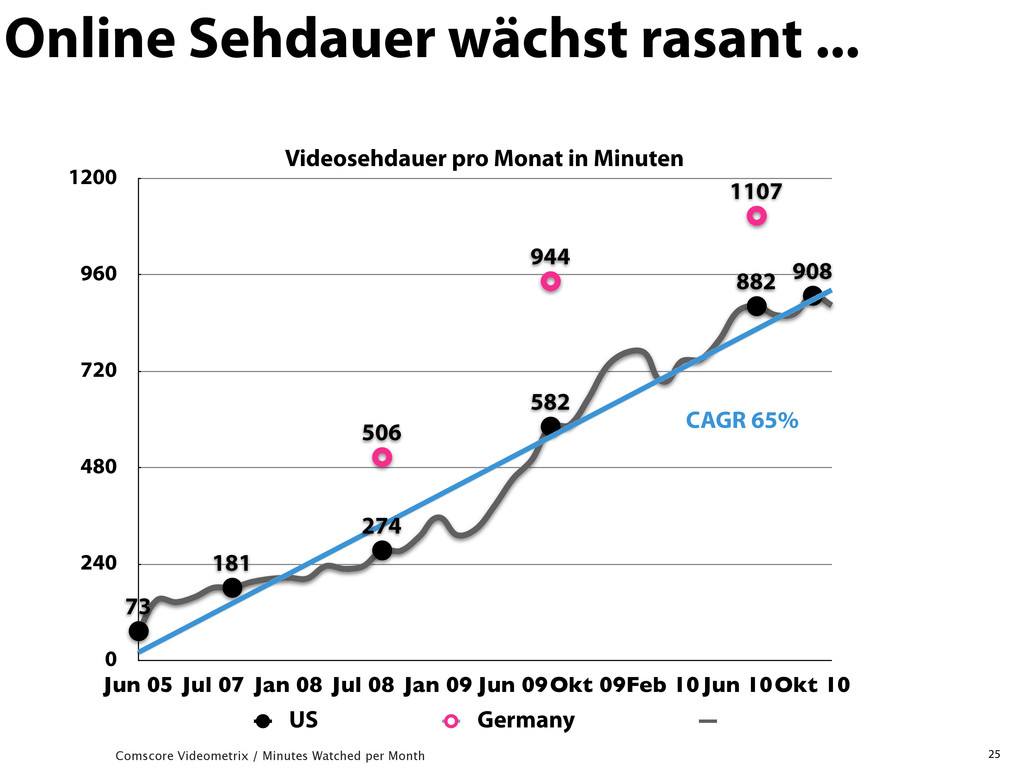
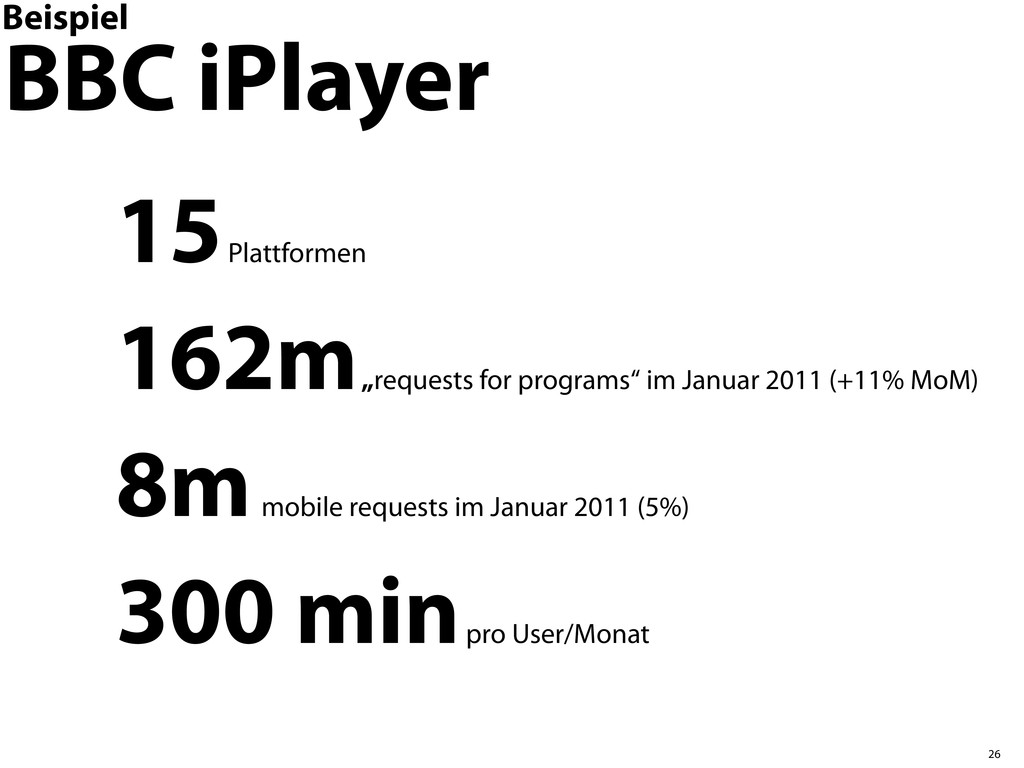
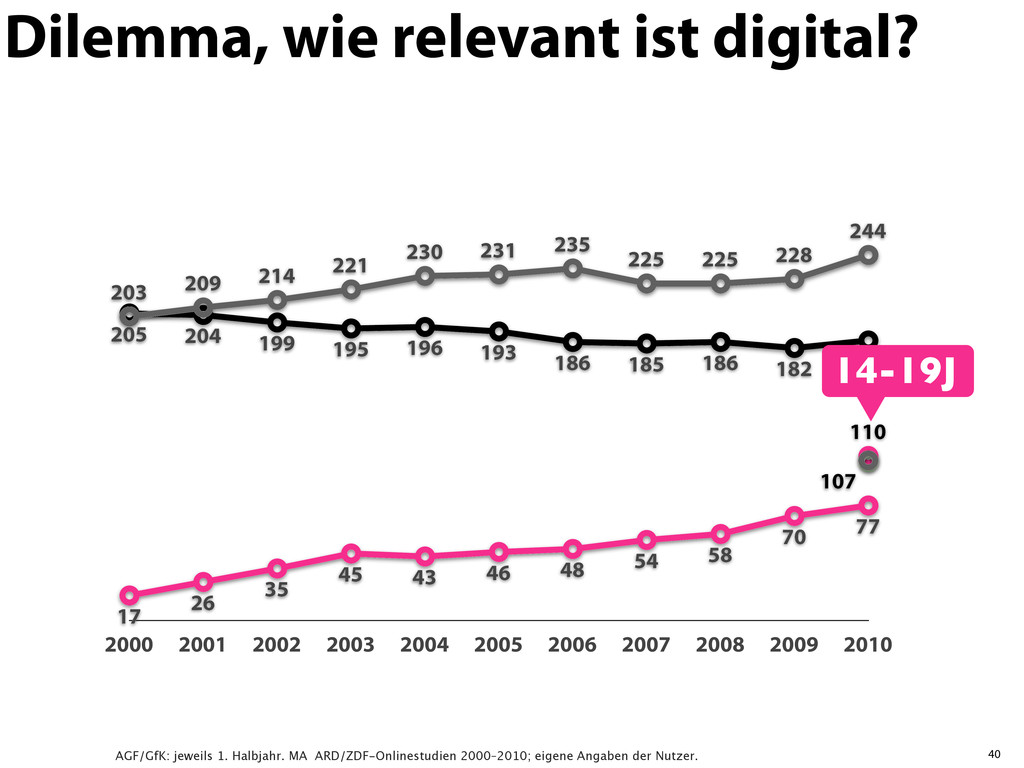
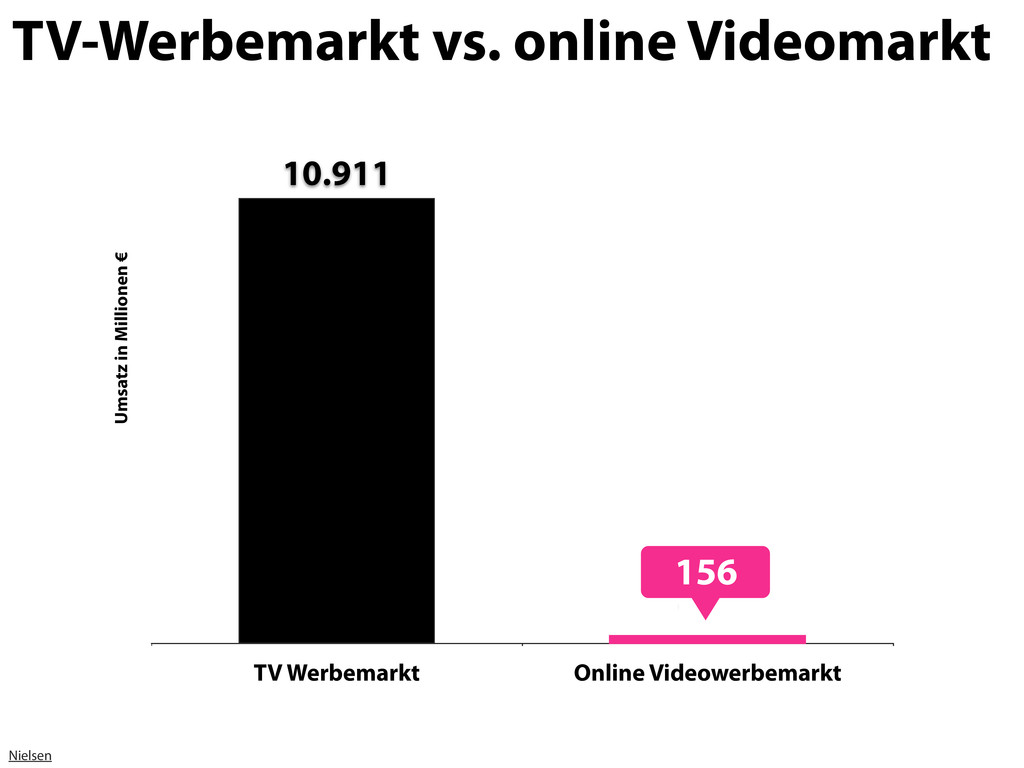
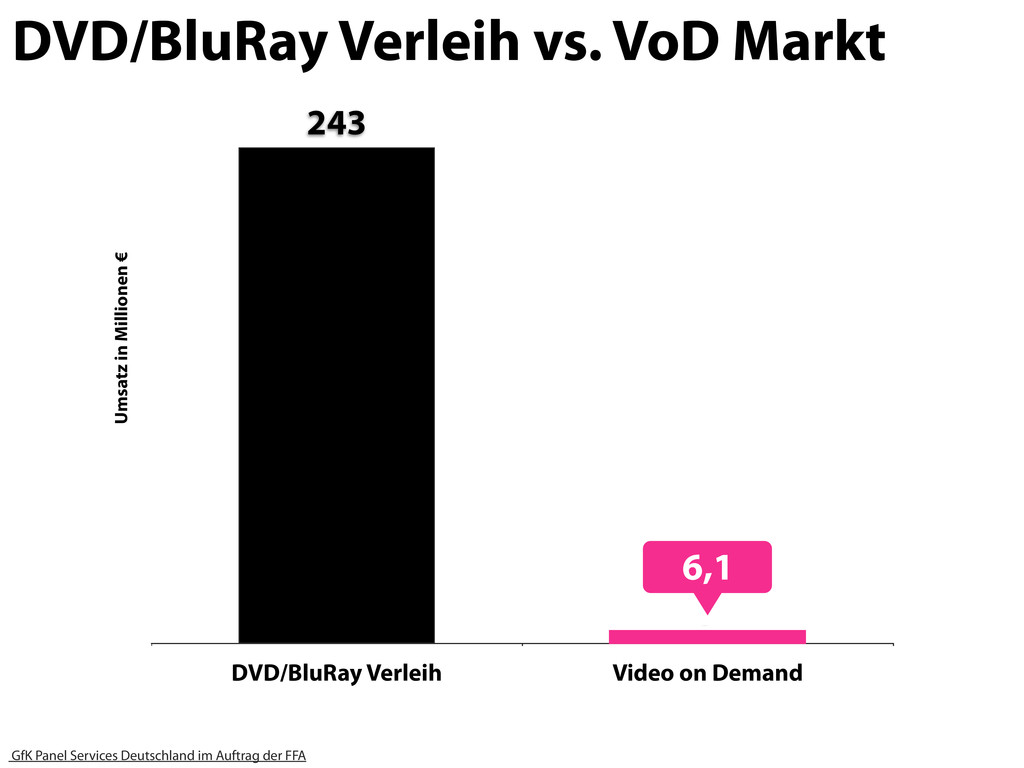
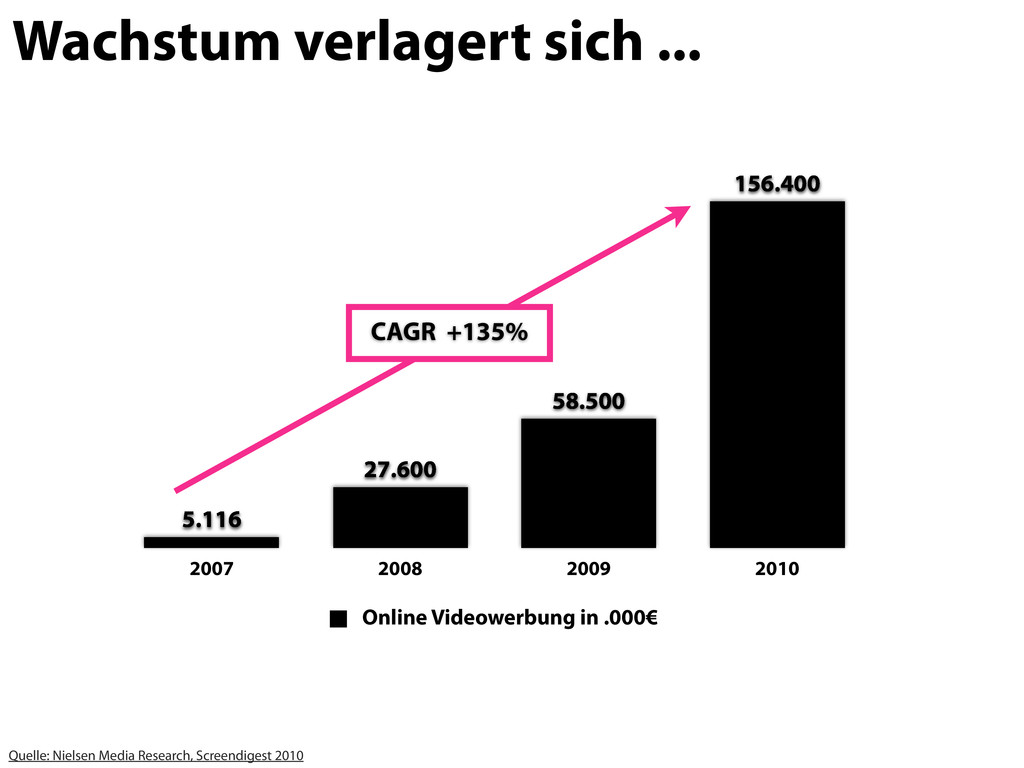
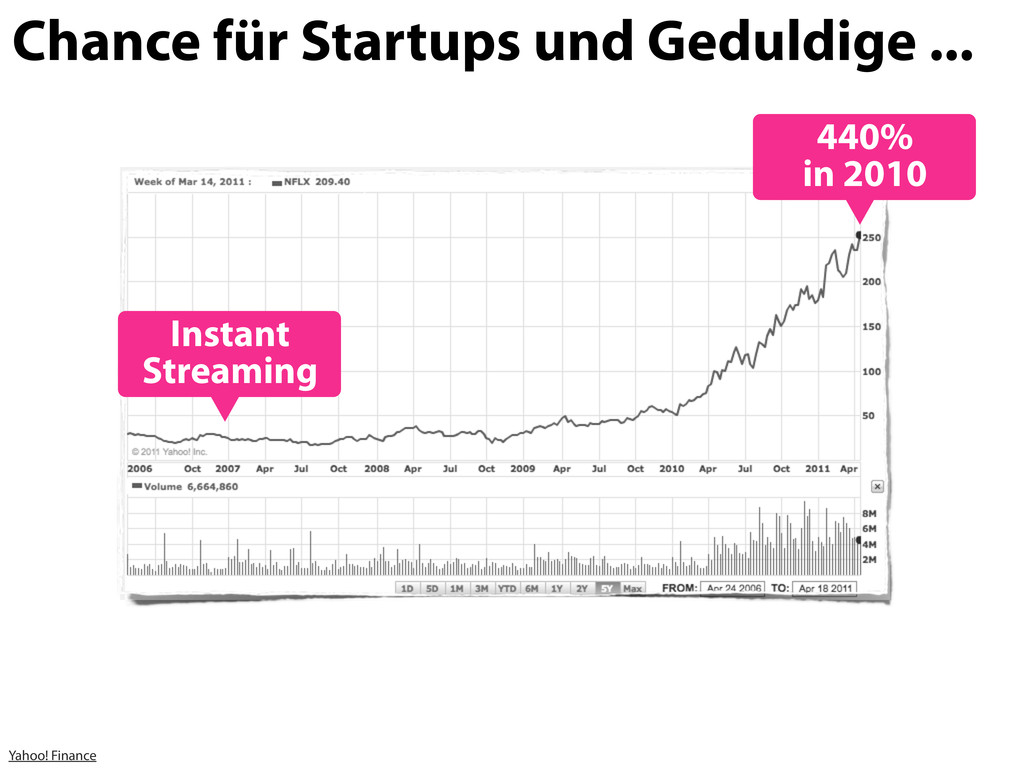
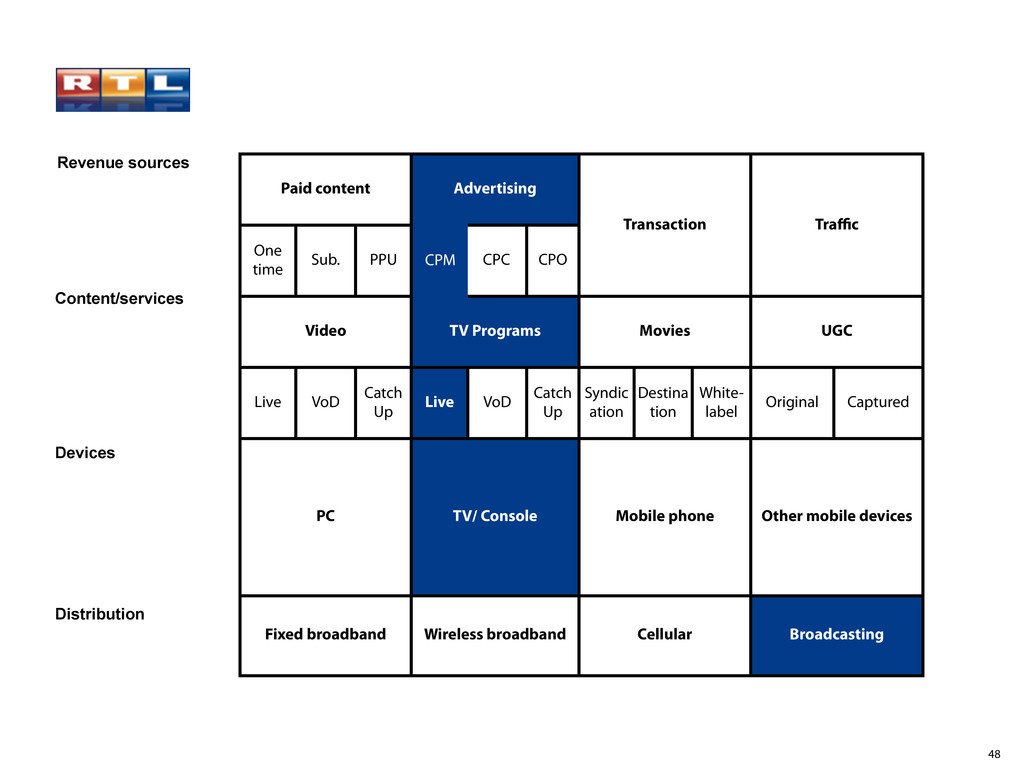
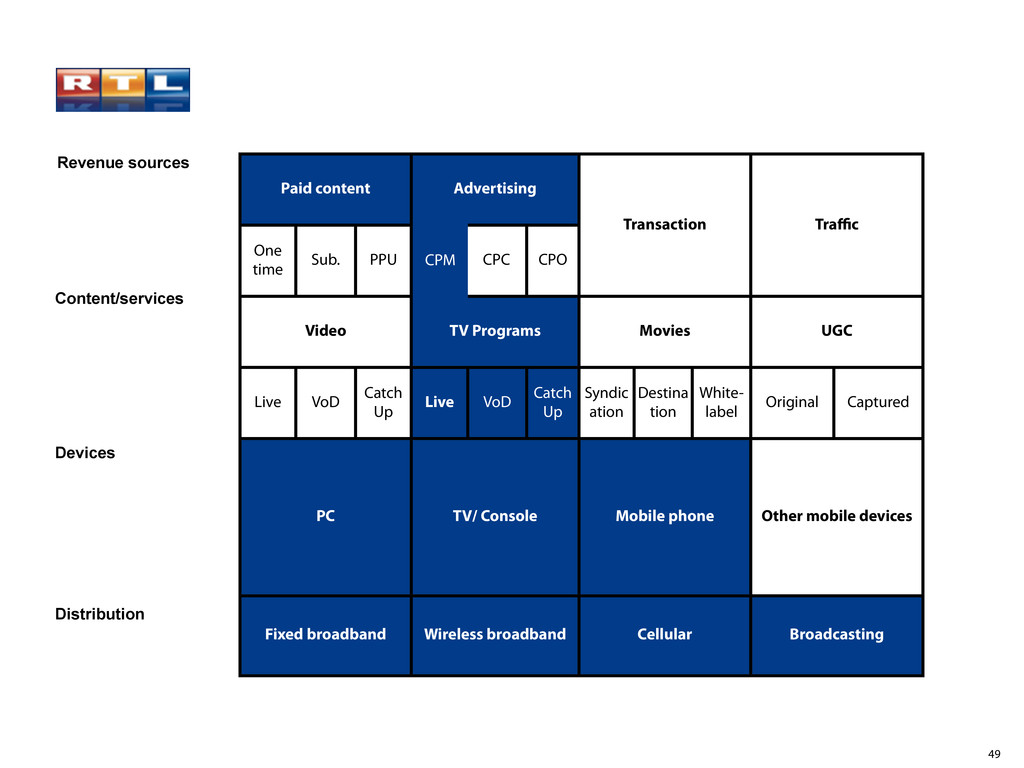
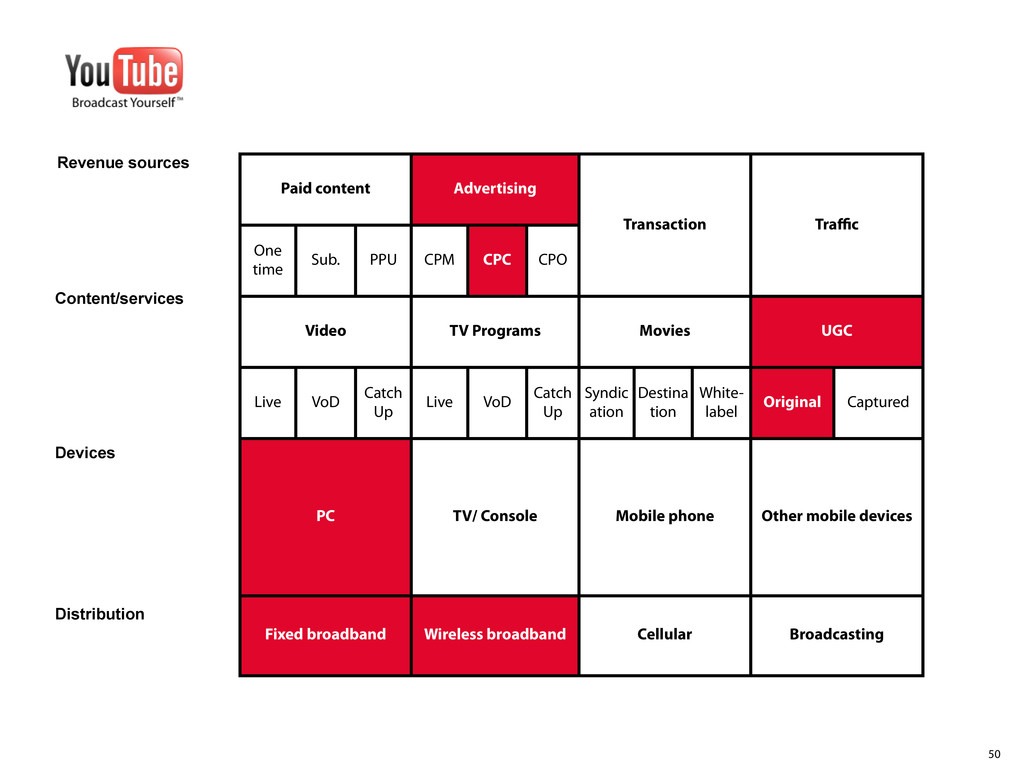
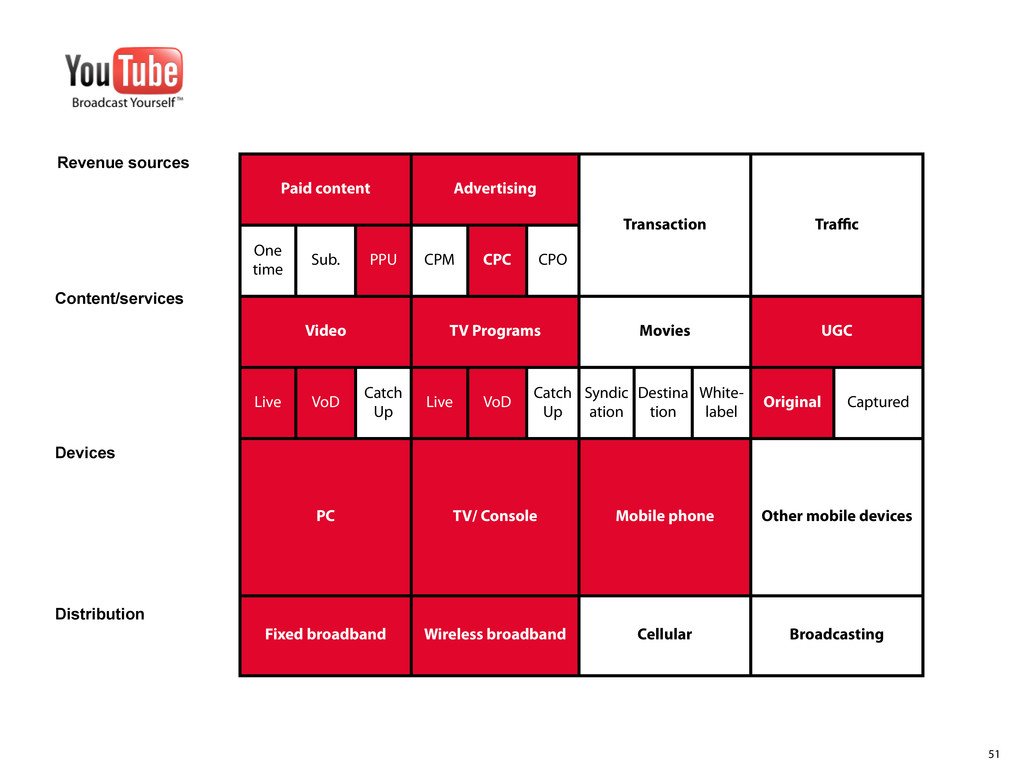
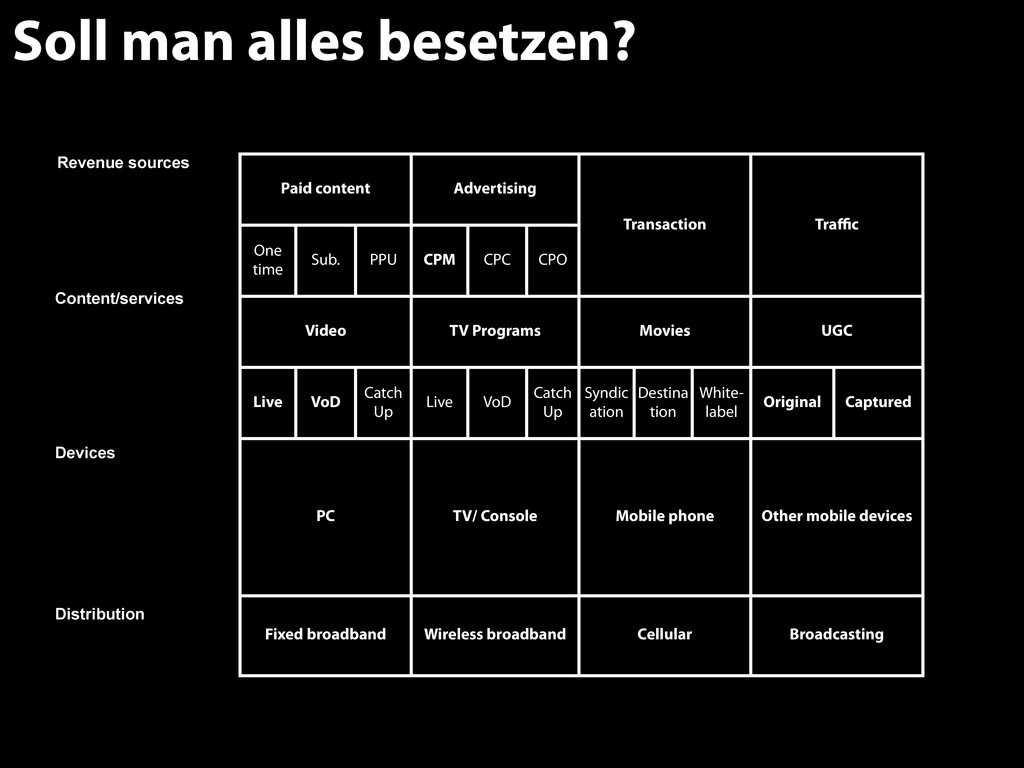
Überblick der Gefahren und Chancen entlang der TV-Wertschöpfungskette. Illustration des Wandels von TV zu Video und der Umsätze mit online Video und digitaler Distribution.

Onlinevortrag am Montag 25. April 2011 im eVideo 2.0 Projekt an der HTW Berlin.

Bertram Gugel

January 02, 2012
Tweet

More Decks by Bertram Gugel

Other Decks in Business

Transcript

  1. Neue STARS entstehen ➡ 87 Millionen Profil Aufrufe auf MySpace

    ➡ 1,36 Millionen Freunde auf MySpace ➡ 309.000 Abonnenten auf YouTube ➡ Ø 550.000 Video Abrufe/Tag ➡ 470 Million Video Abrufe auf YouTube ➡ Univeral Music Deal / #1 Billboard-Charts USA Soulja Boy 7
  2. 200 Mio CBS 900 Mio EPIX (Paramount, Lions Gate &

    M 200 Mio ABC & Disney 100 Mio House of Cards 100 Mio Miramax? Netflix bezahlt für online Inhalte!
  3. 12 Experten analysieren jedes Lied und identifizieren ~400 Merkmale. Pandora

    erstellt Radio Stationen auf Basis der Songs, die ein User mag. Der Inhalt passt sich dem Feedback der User an. ALGORITHMEN MACHEN RADIO
  4. DEMAND MEDIA http://www.wired.com/magazine/2009/10/ff_demandmedia/all/1 Suchanfragen bestimmen welche Videos produziert werden Redakteure

    überarbeiten die Titel der Videos Produzenten holen sich online ihre Aufträge aus der Datenbank. Fertige Videos werden gecheckt und mit Werbung vermarktet. SUCHROBOTER SETZEN THEMEN
  5. Comcast Netflix DirectTV Dish Time Warner Cox 5.038 12.706 14.318

    18.760 20.000 23.212 Subscribers in Thousands Netflix vs. PayTV Plattformen
  6. HBO Netflix Showtime Starz 17.300 18.200 20.000 28.600 Subscribers in

    Thousands Netflix vs. PayTV Kanäle http://www.hollywoodreporter.com/news/exclusive-hbo-subscribers-dwindling-27724
  7. ... hat gerade erst begonnen! Spielekonsolen 182m Units sold Internet

    Boxen GoogleTV, Roku, TV, Vudu DVRs TiVo, CE-Manufaturer Blu-Ray Player Sony, LG, Panasonic TV Sony, LG, Panasonic PC Anbieter Apple, Microsoft, Asus Mobile Geräte iPod, Zune HD, A Startups Boxee, Plex, XMBC, ... Hardware Herst. WD, LaCie, ...
  8. 25 Comscore Videometrix / Minutes Watched per Month Online Sehdauer

    wächst rasant ... 0 240 480 720 960 1200 Jun 05 Jul 07 Jan 08 Jul 08 Jan 09 Jun 09Okt 09Feb 10Jun 10Okt 10 506 944 1107 73 181 274 582 882 908 US Germany CAGR 65% Videosehdauer pro Monat in Minuten
  9. 26 BBC iPlayer Beispiel 15 Plattformen 162m „requests for programs“

    im Januar 2011 (+11% MoM) 8m mobile requests im Januar 2011 (5%) 300 min pro User/Monat
  10. 27 88% der Nutzer sehen TV-Inhalte on demand 12% live

    Internet ist ein on demand Medium http://www.bbc.co.uk/blogs/bbcinternet/2011/02/january_2011_bbc_iplayer_month.html
  11. 29 0 3 6 9 12 2003 2004 2005 2006

    2007 2008 2009 2010 10,7 10,3 8 5,7 7 8,4 8,9 11,4 Kategorietitel Zuschauer in Mio. MTV VMA Zuschauer
  12. 33 http://www.engadget.com/2011/01/29/study-shocker-mobile-users-piddle-around-on-the-internet-while 86% 14% No Usage Mobile Internet usage Parallele

    Smartphone Nutzung während des Fernsehens 56 % 40 % 37 % 33 % Mobile Apps Browsing Social Networking Texting Nutzer sind gleichzeitig im Netz ...
  13. 37 „We’re moving to a ,best screen available‘ model, where

    consumers are going to want to watch what they want, when they want, on whatever screen is around right NOW.“ http://www.businessinsider.com/jim-louderback-future-of-cable-tv-2010-4#ixzz0mmo7WfvC
  14. 39 AGF/GfK: jeweils 1. Halbjahr. MA ARD/ZDF-Onlinestudien 2000–2010; eigene Angaben

    der Nutzer. 2000 2001 2002 2003 2004 2005 2006 2007 2008 2009 2010 17 26 35 45 43 46 48 54 58 70 77 205 204 199 195 196 193 186 185 186 182 187 203 209 214 221 230 231 235 225 225 228 244 Fernsehen Radio Internet Dilemma, wie relevant ist digital?
  15. 40 AGF/GfK: jeweils 1. Halbjahr. MA ARD/ZDF-Onlinestudien 2000–2010; eigene Angaben

    der Nutzer. 2000 2001 2002 2003 2004 2005 2006 2007 2008 2009 2010 110 107 17 26 35 45 43 46 48 54 58 70 77 205 204 199 195 196 193 186 185 186 182 187 203 209 214 221 230 231 235 225 225 228 244 Dilemma, wie relevant ist digital? 14-19J
  16. TV Werbemarkt Online Videowerbemarkt 156 10.911 Umsatz in Millionen €

    TV-Werbemarkt vs. online Videomarkt Nielsen 156
  17. DVD/BluRay Verleih Video on Demand 6,1 243 Umsatz in Millionen

    € DVD/BluRay Verleih vs. VoD Markt GfK Panel Services Deutschland im Auftrag der FFA 6,1
  18. Wachstum verlagert sich ... Quelle: Nielsen Media Research, Screendigest 2010

    2007 2008 2009 2010 156.400 58.500 27.600 5.116 Online Videowerbung in .000€ CAGR +135%
  19. 47 Revenue sources Content/services Devices Distribution Paid content Paid content

    Paid content Advertising Advertising Advertising Transaction Transaction Transaction Traffic Traffic One time Sub. PPU CPM CPC CPO Transaction Transaction Transaction Traffic Traffic Video Video Video TV Programs TV Programs TV Programs Movies Movies Movies UGC UGC Live VoD Catch Up Live VoD Catch Up Syndic ation Destina tion White- label Original Captured PC PC PC TV/ Console TV/ Console TV/ Console Mobile phone Mobile phone Mobile phone Other mobile devices Other mobile devices Fixed broadband Fixed broadband Fixed broadband Wireless broadband Wireless broadband Wireless broadband Cellular Cellular Cellular Broadcasting Broadcasting Multiplikation der Geschäftsfelder
  20. 48 Revenue sources Content/services Devices Distribution Paid content Paid content

    Paid content Advertising Advertising Advertising Transaction Transaction Transaction Traffic Traffic One time Sub. PPU CPM CPC CPO Transaction Transaction Transaction Traffic Traffic Video Video Video TV Programs TV Programs TV Programs Movies Movies Movies UGC UGC Live VoD Catch Up Live VoD Catch Up Syndic ation Destina tion White- label Original Captured PC PC PC TV/ Console TV/ Console TV/ Console Mobile phone Mobile phone Mobile phone Other mobile devices Other mobile devices Fixed broadband Fixed broadband Fixed broadband Wireless broadband Wireless broadband Wireless broadband Cellular Cellular Cellular Broadcasting Broadcasting
  21. 49 Revenue sources Content/services Devices Distribution Paid content Paid content

    Paid content Advertising Advertising Advertising Transaction Transaction Transaction Traffic Traffic One time Sub. PPU CPM CPC CPO Transaction Transaction Transaction Traffic Traffic Video Video Video TV Programs TV Programs TV Programs Movies Movies Movies UGC UGC Live VoD Catch Up Live VoD Catch Up Syndic ation Destina tion White- label Original Captured PC PC PC TV/ Console TV/ Console TV/ Console Mobile phone Mobile phone Mobile phone Other mobile devices Other mobile devices Fixed broadband Fixed broadband Fixed broadband Wireless broadband Wireless broadband Wireless broadband Cellular Cellular Cellular Broadcasting Broadcasting
  22. 50 Revenue sources Content/services Devices Distribution Paid content Paid content

    Paid content Advertising Advertising Advertising Transaction Transaction Transaction Traffic Traffic One time Sub. PPU CPM CPC CPO Transaction Transaction Transaction Traffic Traffic Video Video Video TV Programs TV Programs TV Programs Movies Movies Movies UGC UGC Live VoD Catch Up Live VoD Catch Up Syndic ation Destina tion White- label Original Captured PC PC PC TV/ Console TV/ Console TV/ Console Mobile phone Mobile phone Mobile phone Other mobile devices Other mobile devices Fixed broadband Fixed broadband Fixed broadband Wireless broadband Wireless broadband Wireless broadband Cellular Cellular Cellular Broadcasting Broadcasting
  23. 51 Revenue sources Content/services Devices Distribution Paid content Paid content

    Paid content Advertising Advertising Advertising Transaction Transaction Transaction Traffic Traffic One time Sub. PPU CPM CPC CPO Transaction Transaction Transaction Traffic Traffic Video Video Video TV Programs TV Programs TV Programs Movies Movies Movies UGC UGC Live VoD Catch Up Live VoD Catch Up Syndic ation Destina tion White- label Original Captured PC PC PC TV/ Console TV/ Console TV/ Console Mobile phone Mobile phone Mobile phone Other mobile devices Other mobile devices Fixed broadband Fixed broadband Fixed broadband Wireless broadband Wireless broadband Wireless broadband Cellular Cellular Cellular Broadcasting Broadcasting
  24. 52 Revenue sources Content/services Devices Distribution Paid content Paid content

    Paid content Advertising Advertising Advertising Transaction Transaction Transaction Traffic Traffic One time Sub. PPU CPM CPC CPO Transaction Transaction Transaction Traffic Traffic Video Video Video TV Programs TV Programs TV Programs Movies Movies Movies UGC UGC Live VoD Catch Up Live VoD Catch Up Syndic ation Destina tion White- label Original Captured PC PC PC TV/ Console TV/ Console TV/ Console Mobile phone Mobile phone Mobile phone Other mobile devices Other mobile devices Fixed broadband Fixed broadband Fixed broadband Wireless broadband Wireless broadband Wireless broadband Cellular Cellular Cellular Broadcasting Broadcasting Soll man alles besetzen?
  25. 55 Facebook als Payment Plattform Live Votes zum TV Programm

    für Credits Zugang zu on demand Inhalten
  26. 56 http://www.readwriteweb.com/archives/npr_api_delivered_11_billion_stories_in_march.php http://www.npr.org/blogs/inside/2010/04/12/125882632/api-usage-and-metrics „NPR's API allows outside parties to have

    access to audio content dating back to 1995, consisting of more than 250,000 stories in more than 5,000 different aggregations.“ Erste Schritte