Upgrade to Pro — share decks privately, control downloads, hide ads and more …

The geography of scientific research in India (1999-2015)

MarionMai
February 04, 2021

The geography of scientific research in India (1999-2015)

As part of the webinars organised by AVRIST (Association pour la Valorisation des Relations Internationales Scientifiques et Techniques), a round table on "Innovation, Research and Territory" was organised and coordinated by Eric Denis, Director of Research at the CNRS at the UMR Géographie-Cités.

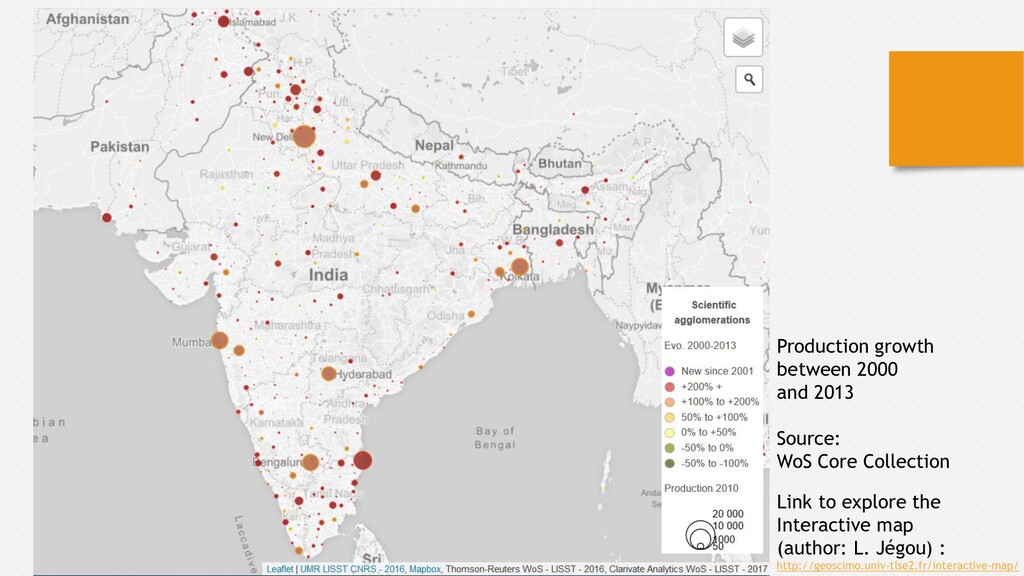
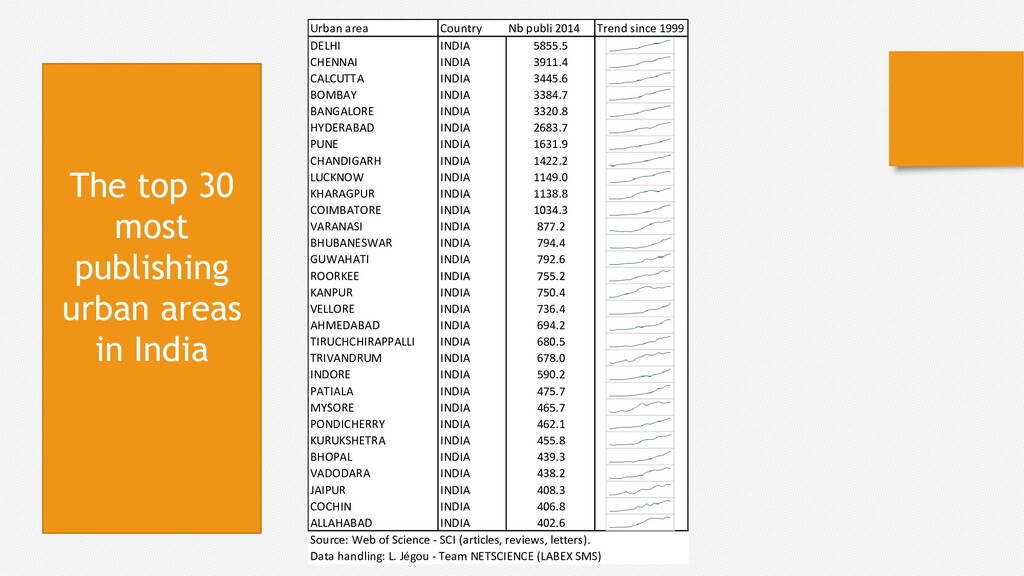
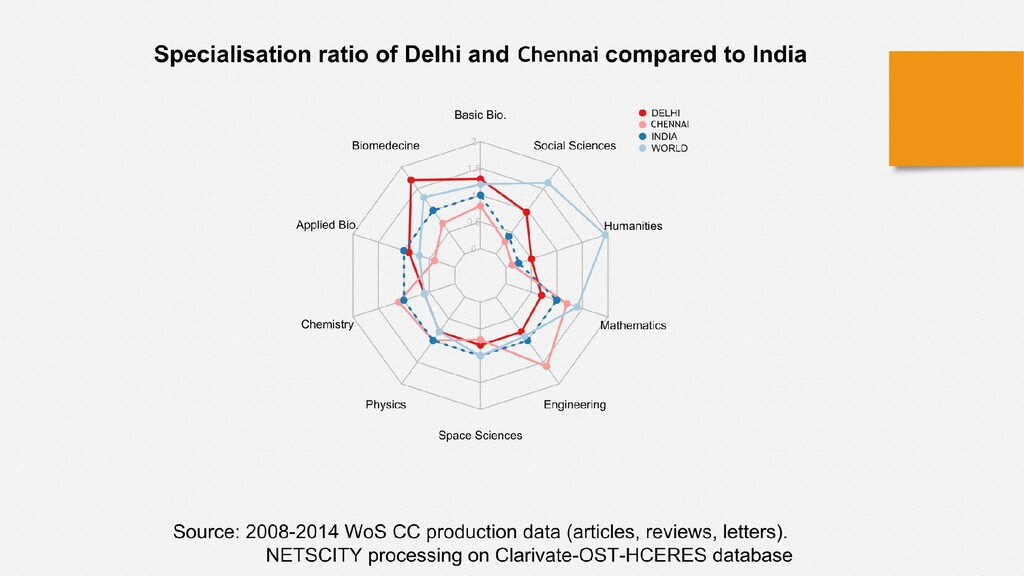
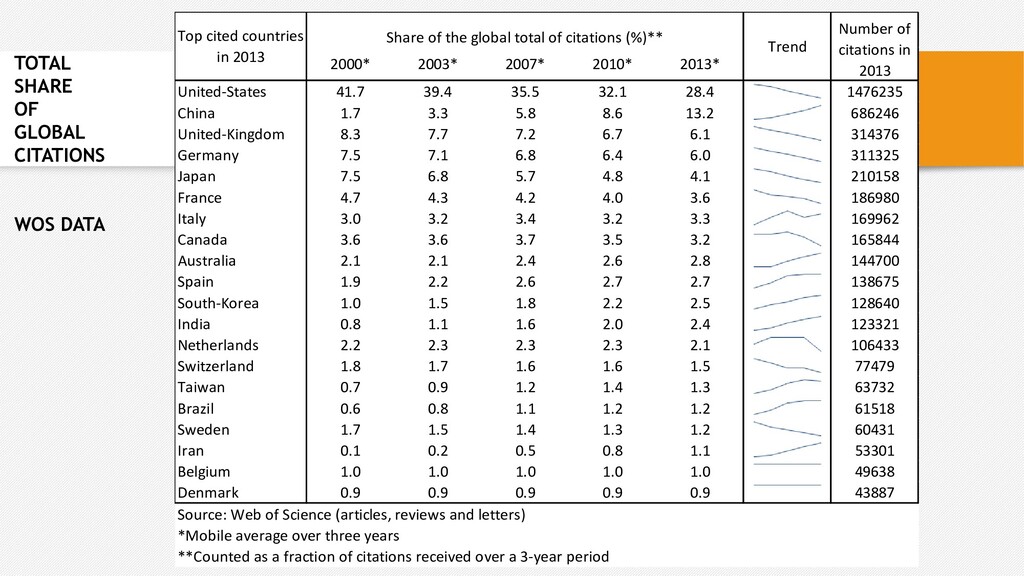
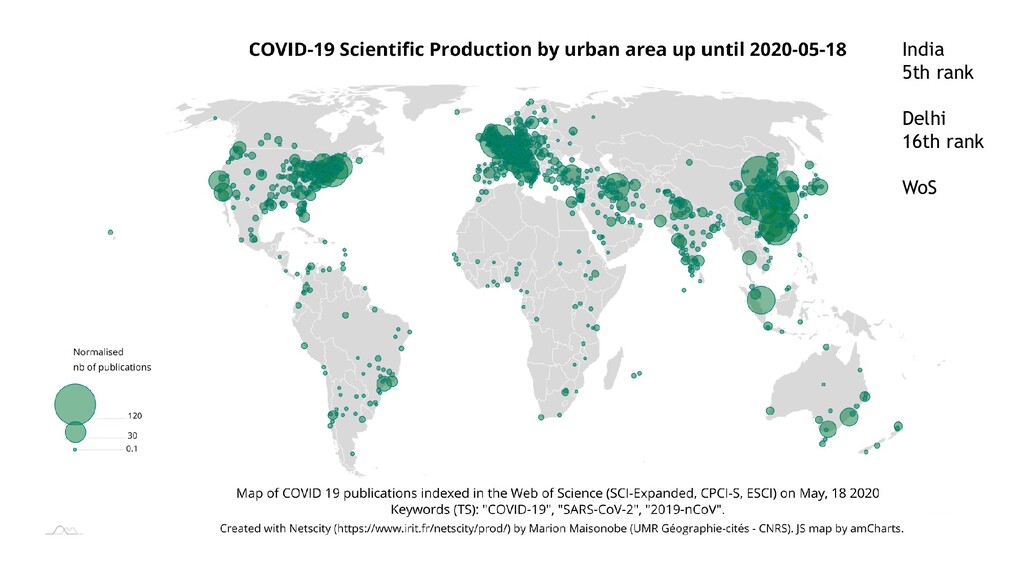
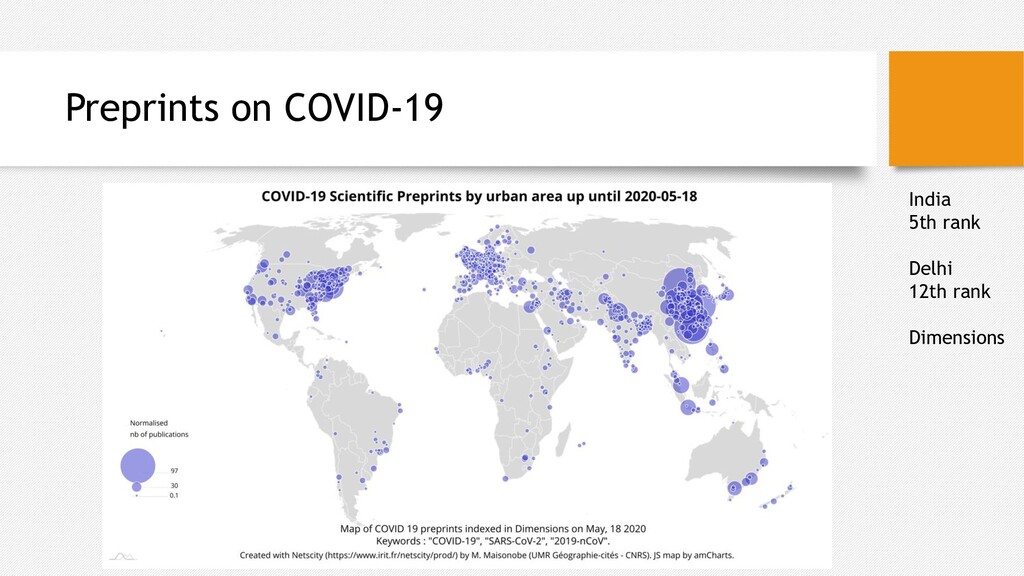
This slideshow is the support presented on the occasion of this event. It focuses on the geography of scientific production in India.

MarionMai

February 04, 2021
Tweet

More Decks by MarionMai

Other Decks in Research

Transcript

  1. The geography of scientific research in India from 1999 to

    2015 Marion Maisonobe – CNRS - UMR Géographie-cités Marion.maisonobe<at>cnrs.fr http://geoscimo.univ-tlse2.fr/
  2. FRAME of THIS RESEARCH • ANR Géoscience 2010-2013 • NETSCIENCE

    project – LABEX SMS – TOULOUSE • NETSCITY project 2018-2021 – UMR Géographie-cités – UMR LISST – UMR IRIT • Collaborators: Laurent Jégou, Béatrice Milard, Denis Eckert, Michel Grossetti, Guillaume Cabanac OUTPUTS : • Website: http://geoscimo.univ-tlse2.fr/ • Collective book: Les Ancrages Nationaux de la Science Mondiale XVIIe-XXIe siècles, IRD Editions/EDAC • Special issue in the journal M@ppemonde • Special issue in La Revue Française de Sociologie • Research articles in Urban studies, Informetrics and Scientometrics
  3. Data and method • In 2013, more than 10 000

    revues and about 2 millions of publications indexed in the Web of Science (SCI Exp, SSCI, AHCI) 1. GEOCODING : Almost 98% of all WoS publications (articles, reviews, letters) have been geocoded (1999-2014) = 19 millions publications 2. CLUSTERING : After the geocoding, the publication data are clustered by urban areas 3. COUNTING : Whole normalized counting (Gauffriau et al., 2008) Eckert et al., 2013; Jégou, 2014; Grossetti et al., 2014; Maisonobe et al., 2016
  4. The example of: Mumbai & Pune Method and dataset On

    line on CYBERGEO Maisonobe, Jégou & Eckert, 2018 URBAN AREAS DELINEATION ACC. TO POPULATION DENSITY – SPATIAL DATASET AVAILABLE ONLINE
  5. Link to explore the Interactive map (author: L. Jégou) :

    http://geoscimo.univ-tlse2.fr/interactive-map/ Production growth between 2000 and 2013 Source: WoS Core Collection
  6. The top 30 most publishing urban areas in India Urban

    area Country Nb publi 2014 Trend since 1999 DELHI INDIA 5855.5 CHENNAI INDIA 3911.4 CALCUTTA INDIA 3445.6 BOMBAY INDIA 3384.7 BANGALORE INDIA 3320.8 HYDERABAD INDIA 2683.7 PUNE INDIA 1631.9 CHANDIGARH INDIA 1422.2 LUCKNOW INDIA 1149.0 KHARAGPUR INDIA 1138.8 COIMBATORE INDIA 1034.3 VARANASI INDIA 877.2 BHUBANESWAR INDIA 794.4 GUWAHATI INDIA 792.6 ROORKEE INDIA 755.2 KANPUR INDIA 750.4 VELLORE INDIA 736.4 AHMEDABAD INDIA 694.2 TIRUCHCHIRAPPALLI INDIA 680.5 TRIVANDRUM INDIA 678.0 INDORE INDIA 590.2 PATIALA INDIA 475.7 MYSORE INDIA 465.7 PONDICHERRY INDIA 462.1 KURUKSHETRA INDIA 455.8 BHOPAL INDIA 439.3 VADODARA INDIA 438.2 JAIPUR INDIA 408.3 COCHIN INDIA 406.8 ALLAHABAD INDIA 402.6 Source: Web of Science - SCI (articles, reviews, letters). Data handling: L. Jégou - Team NETSCIENCE (LABEX SMS)
  7. Evolution of the scientific production bet. 2000 and 2013. Source

    : Web of Science (articles, reviews, letters) Conception et réalisation: Laurent Jégou Crédit: L. Jégou et M. Maisonobe
  8. World context • an increase in the number of higher

    education personnel • a re-balancing of the global scientific output over the last thirty years - at the country level to the detriment of the traditional hegemony of the US (Adams & Pendlebury, 2010 ; Royal Society, 2011) - and at the city level to the detriment of the traditional biggest spots (Inhaber, 1977; Grossetti et al., 2014)
  9. 2000* 2003* 2007* 2010* 2013* United-States 41.7 39.4 35.5 32.1

    28.4 1476235 China 1.7 3.3 5.8 8.6 13.2 686246 United-Kingdom 8.3 7.7 7.2 6.7 6.1 314376 Germany 7.5 7.1 6.8 6.4 6.0 311325 Japan 7.5 6.8 5.7 4.8 4.1 210158 France 4.7 4.3 4.2 4.0 3.6 186980 Italy 3.0 3.2 3.4 3.2 3.3 169962 Canada 3.6 3.6 3.7 3.5 3.2 165844 Australia 2.1 2.1 2.4 2.6 2.8 144700 Spain 1.9 2.2 2.6 2.7 2.7 138675 South-Korea 1.0 1.5 1.8 2.2 2.5 128640 India 0.8 1.1 1.6 2.0 2.4 123321 Netherlands 2.2 2.3 2.3 2.3 2.1 106433 Switzerland 1.8 1.7 1.6 1.6 1.5 77479 Taiwan 0.7 0.9 1.2 1.4 1.3 63732 Brazil 0.6 0.8 1.1 1.2 1.2 61518 Sweden 1.7 1.5 1.4 1.3 1.2 60431 Iran 0.1 0.2 0.5 0.8 1.1 53301 Belgium 1.0 1.0 1.0 1.0 1.0 49638 Denmark 0.9 0.9 0.9 0.9 0.9 43887 **Counted as a fraction of citations received over a 3-year period Top cited countries in 2013 Share of the global total of citations (%)** Trend Number of citations in 2013 Source: Web of Science (articles, reviews and letters) *Mobile average over three years TOTAL SHARE OF GLOBAL CITATIONS WOS DATA
  10. Pays 2000 2003 2007 2010 2013 Trend Number of publications

    in the 1% top cited 2013 UNITED-STATES 50.0 48.1 45.2 42.1 38.8 5142 CHINA 1.6 3.3 5.0 7.2 10.5 1394 UNITED-KINGDOM 8.7 8.3 8.1 8.0 8.2 1094 GERMANY 6.1 5.6 5.6 5.6 5.5 726 CANADA 3.4 3.5 3.8 3.8 3.4 447 AUSTRALIA 2.0 2.0 2.5 2.9 3.3 438 FRANCE 4.1 3.6 3.5 3.3 3.0 395 ITALY 2.4 2.4 2.5 2.5 2.5 337 NETHERLANDS 2.2 2.4 2.5 2.6 2.5 326 JAPAN 4.9 4.1 3.3 2.6 2.1 278 SPAIN 1.4 1.6 1.7 2.0 2.0 265 SWITZERLAND 1.9 1.8 1.8 1.8 1.7 222 SOUTH-KOREA 0.7 1.1 1.1 1.3 1.5 204 SWEDEN 1.4 1.4 1.2 1.1 1.2 160 INDIA 0.6 0.9 1.0 1.1 1.1 151 BELGIUM 0.8 0.9 0.9 1.1 1.0 136 SINGAPORE 0.3 0.5 0.6 0.8 1.0 135 DENMARK 0.9 0.9 0.9 0.9 1.0 131 IRAN 0.0 0.1 0.4 0.5 0.7 96 TOP 1% highly cited publications per Web of Science categories (articles, reviews and letters) Data processed by L. Jégou, G. Cabanac and M. Maisonobe. WoS version maintained by OST-HCERES TOP 1% HIGHLY CITED PUBLICATIONS
  11. Deconcentration and diversification of the places of production of scientific

    publications Global share of publications, collaborations, and citations, per country 1999-2014 (source: GEOINNO 2018, Barcelone – Maisonobe, Grossetti, Milard, Jégou, Eckert)
  12. Scientific collaboration of India with the rest of the world

    (2007-2015) Source: SCI Expanded (2007-2015). MM % 1999-2006 2007-2015 India (intra) 43.2 53.5 Europe 22.2 15.9 Asia 18.0 13.6 N-America 13.2 13.0 Oceania 1.5 1.6 Africa 1.1 1.4 S-America 0.8 0.9
  13. 15 Thank you for your attention! Map taken from Maisonobe

    et al. La Revue Française De Sociologie, 2016
  14. Number of publications on COVID-19 up until December 2020 (retrieved

    on January 2021) M. Maisonobe, L. Jégou & G. Cabanac, ongoing work, data processed with NETSCITY. See: http://geoscimo.univ-tlse2.fr/where-do-covid-19- researches-come-from/
  15. Mobility pattern (2008-2015) Robinson-Garcia et al., 2018 The many faces

    of mobility: Using bibliometric data to measure the movement of scientists Source: WoS Core Collection
  16. Mobility pattern (2008-2015) Robinson-Garcia et al., 2018 The many faces

    of mobility: Using bibliometric data to measure the movement of scientists Source: WoS Core Collection