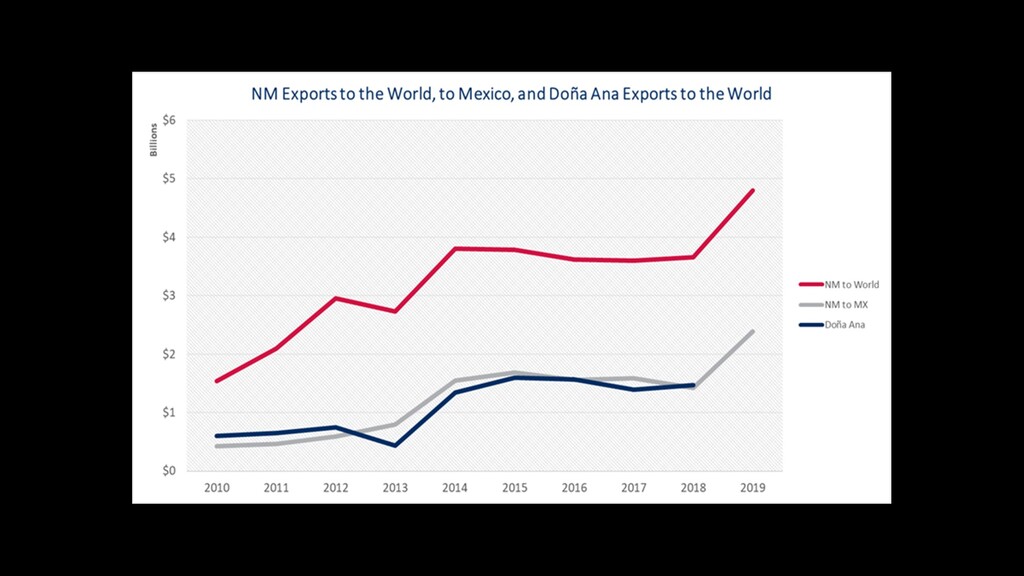
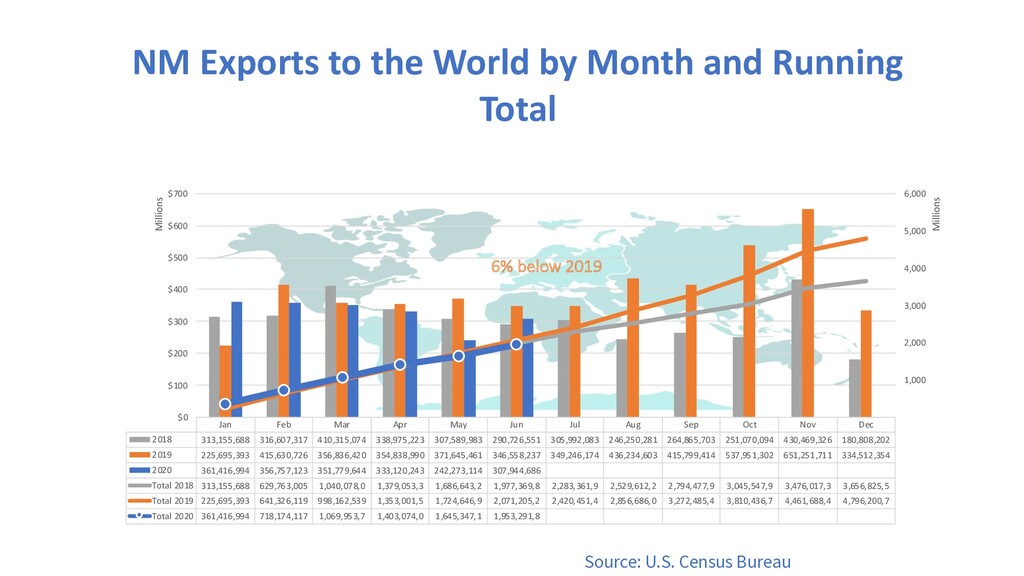
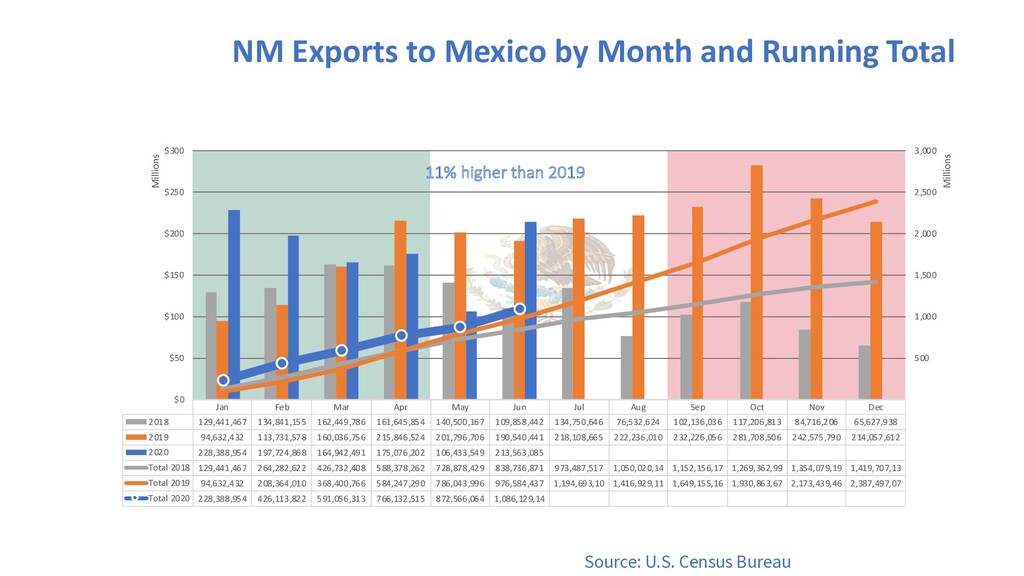
Nov Dec 2018 313,155,688 316,607,317 410,315,074 338,975,223 307,589,983 290,726,551 305,992,083 246,250,281 264,865,703 251,070,094 430,469,326 180,808,202 2019 225,695,393 415,630,726 356,836,420 354,838,990 371,645,461 346,558,237 349,246,174 436,234,603 415,799,414 537,951,302 651,251,711 334,512,354 2020 361,416,994 356,757,123 351,779,644 333,120,243 242,273,114 307,944,686 Total 2018 313,155,688 629,763,005 1,040,078,0 1,379,053,3 1,686,643,2 1,977,369,8 2,283,361,9 2,529,612,2 2,794,477,9 3,045,547,9 3,476,017,3 3,656,825,5 Total 2019 225,695,393 641,326,119 998,162,539 1,353,001,5 1,724,646,9 2,071,205,2 2,420,451,4 2,856,686,0 3,272,485,4 3,810,436,7 4,461,688,4 4,796,200,7 Total 2020 361,416,994 718,174,117 1,069,953,7 1,403,074,0 1,645,347,1 1,953,291,8 1,000 2,000 3,000 4,000 5,000 6,000 $0 $100 $200 $300 $400 $500 $600 $700 Millions Millions NM Exports to the World by Month and Running Total 6% below 2019 Source: U.S. Census Bureau