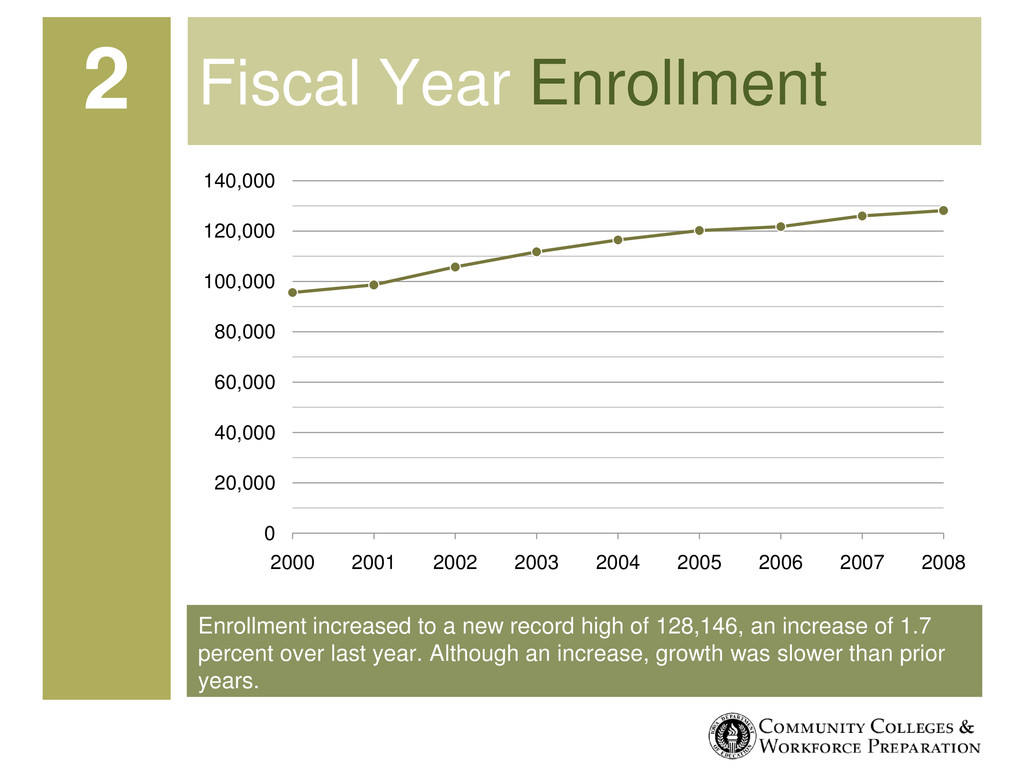
increase of 1.7 percent over last year. Although an increase, growth was slower than prior years. Fiscal Year Enrollment 2 0 20,000 40,000 60,000 80,000 100,000 120,000 140,000 2000 2001 2002 2003 2004 2005 2006 2007 2008
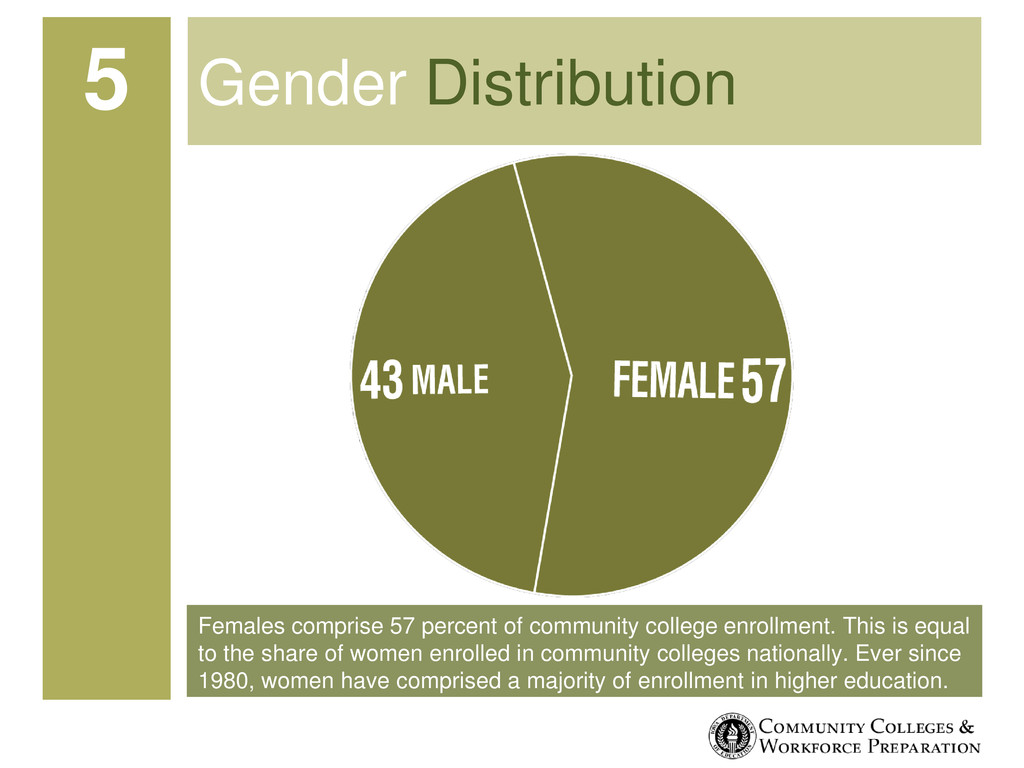
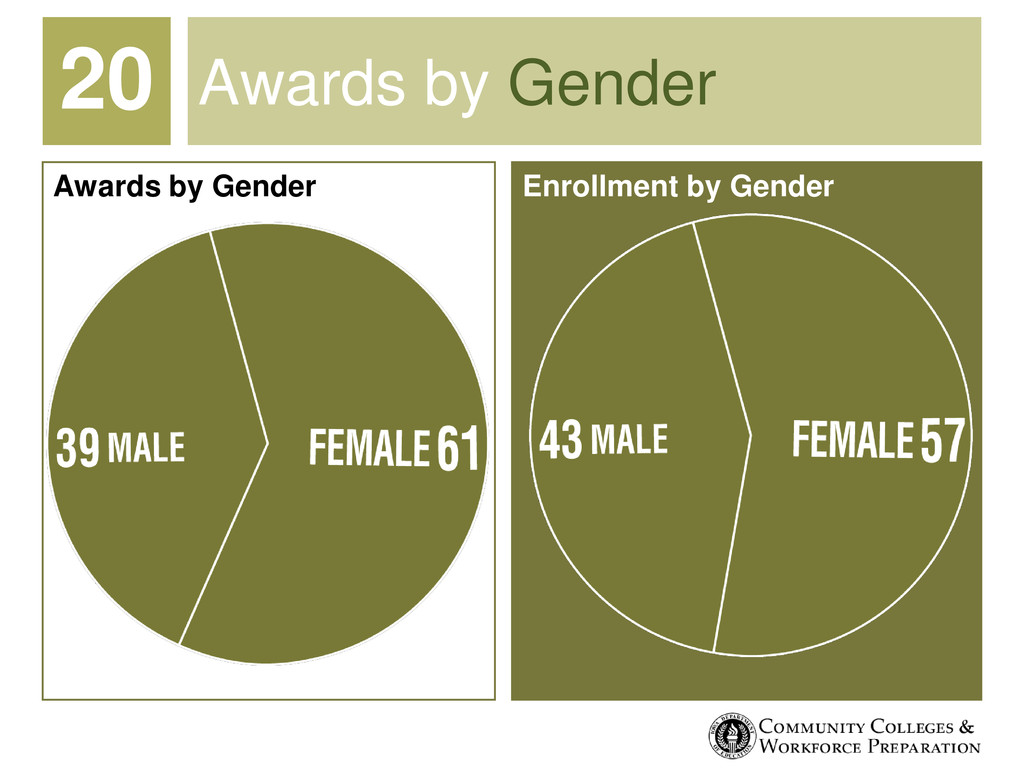
equal to the share of women enrolled in community colleges nationally. Ever since 1980, women have comprised a majority of enrollment in higher education. Gender Distribution 5
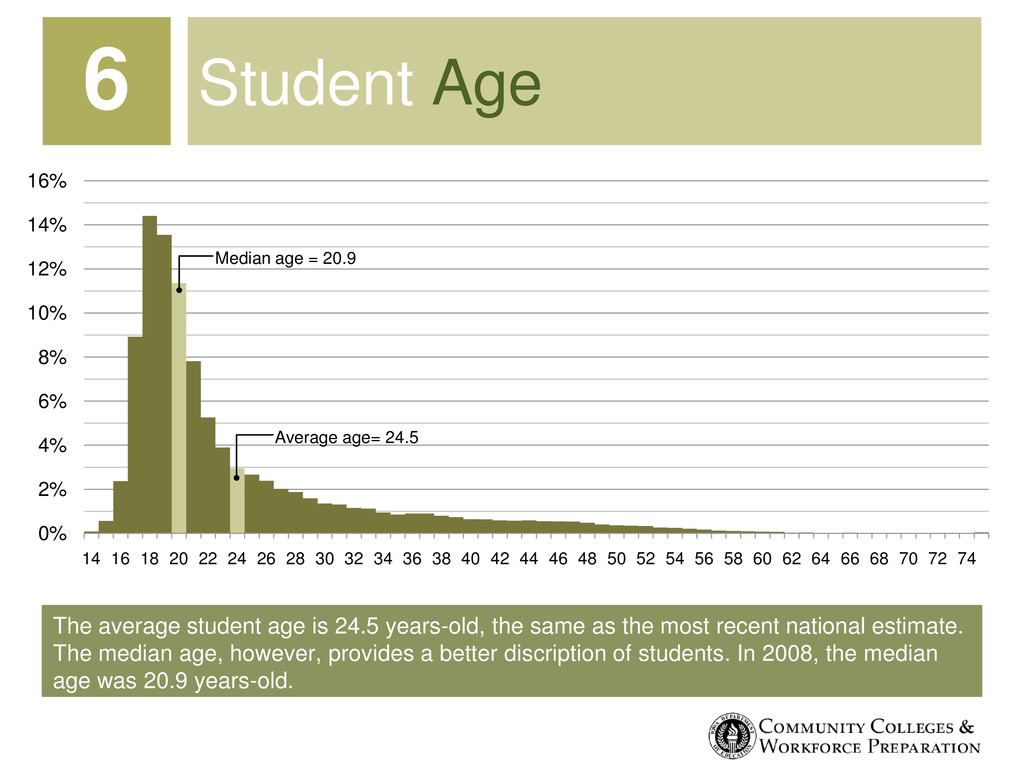
the most recent national estimate. The median age, however, provides a better discription of students. In 2008, the median age was 20.9 years-old. Student Age 6 0% 2% 4% 6% 8% 10% 12% 14% 16% 14 16 18 20 22 24 26 28 30 32 34 36 38 40 42 44 46 48 50 52 54 56 58 60 62 64 66 68 70 72 74 Median age = 20.9 Average age= 24.5
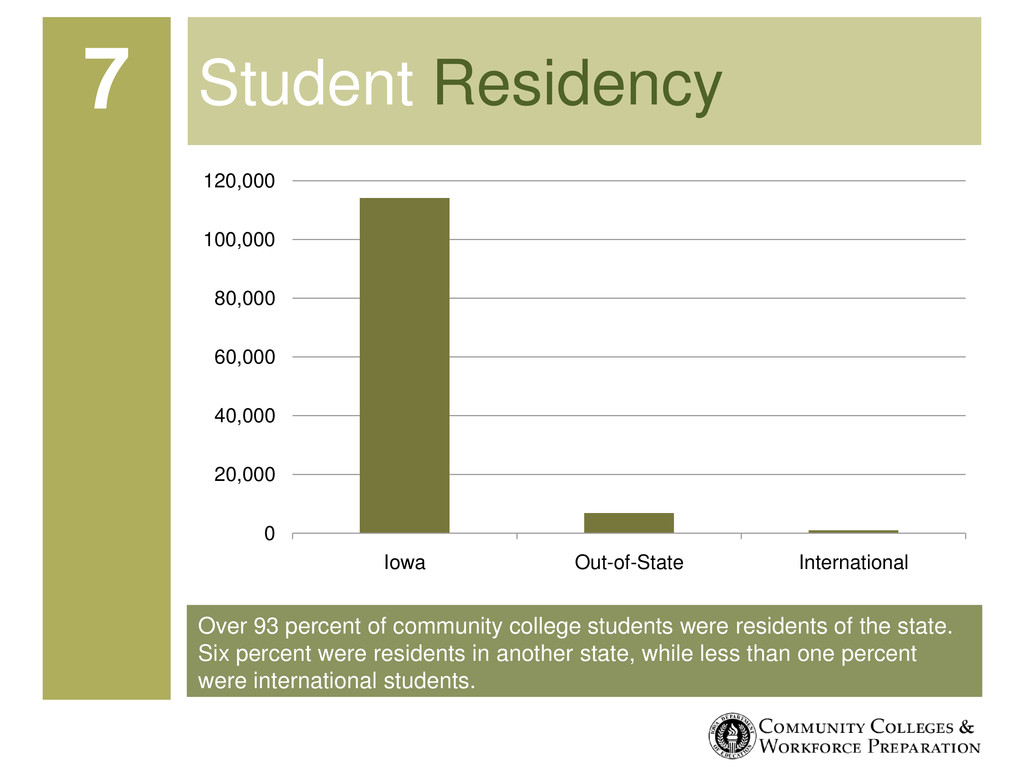
the state. Six percent were residents in another state, while less than one percent were international students. Student Residency 7 0 20,000 40,000 60,000 80,000 100,000 120,000 Iowa Out-of-State International
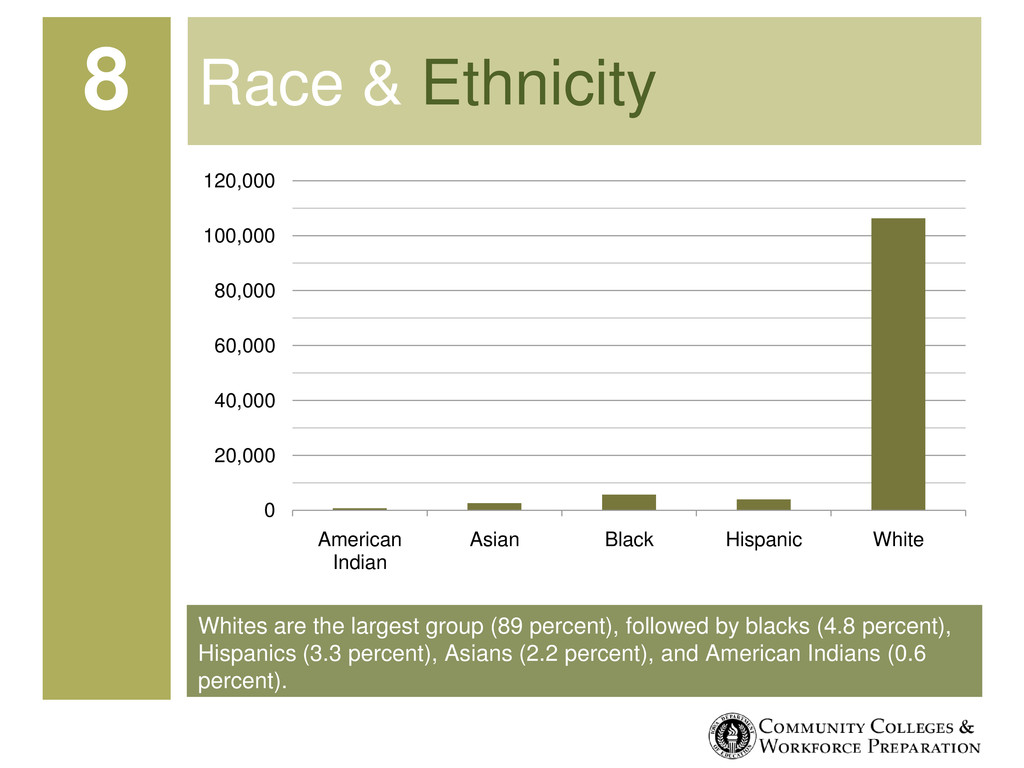
(4.8 percent), Hispanics (3.3 percent), Asians (2.2 percent), and American Indians (0.6 percent). Race & Ethnicity 8 0 20,000 40,000 60,000 80,000 100,000 120,000 American Indian Asian Black Hispanic White
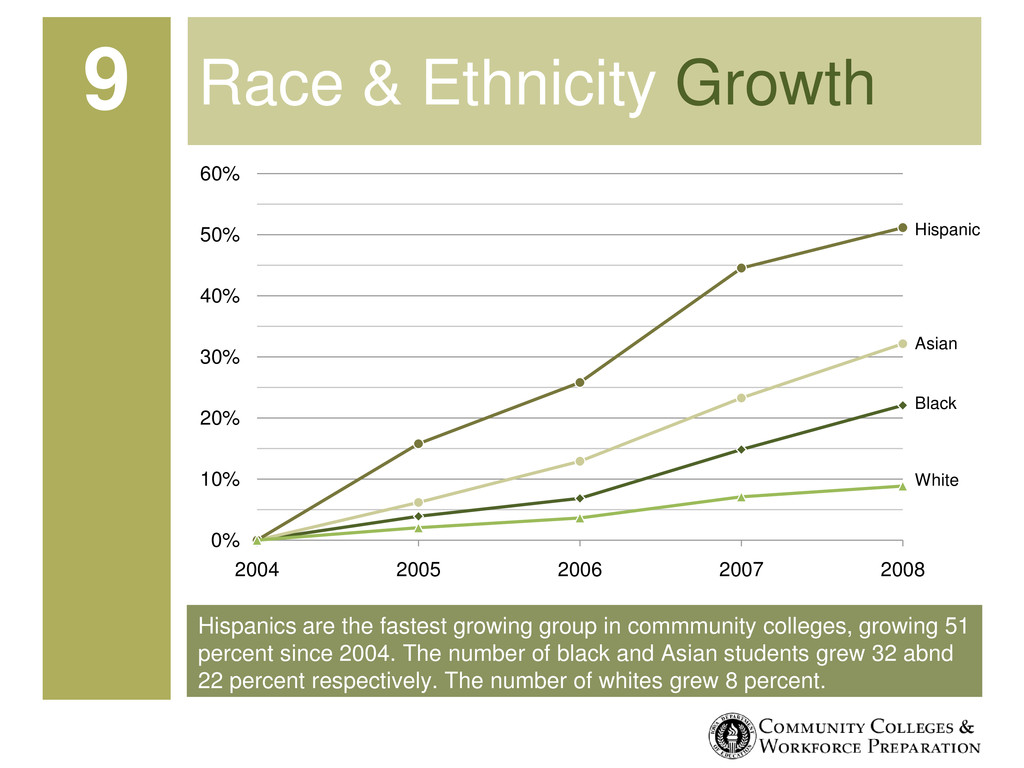
51 percent since 2004. The number of black and Asian students grew 32 abnd 22 percent respectively. The number of whites grew 8 percent. Race & Ethnicity Growth 9 0% 10% 20% 30% 40% 50% 60% 2004 2005 2006 2007 2008 Hispanic Asian Black White
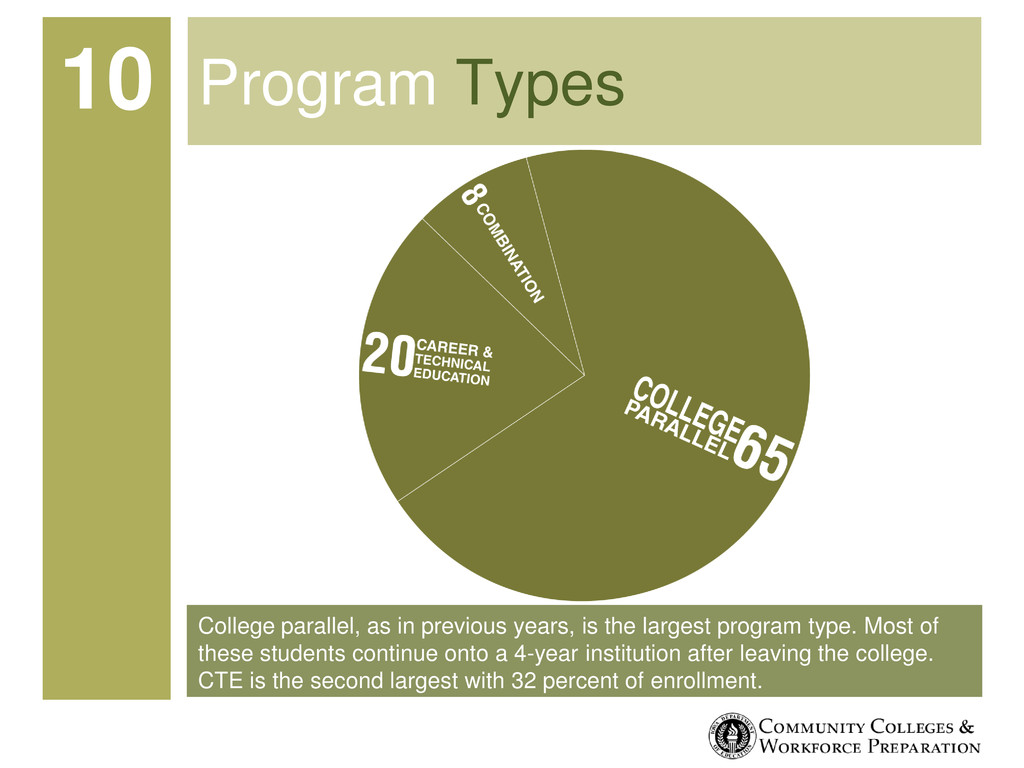
type. Most of these students continue onto a 4-year institution after leaving the college. CTE is the second largest with 32 percent of enrollment. Program Types 10
and Natural Resources Architecture and Construction Arts, A/V Technology and Communications Business, Management and Administration Education and Training Finance Government and Public Administration Health Science Hospitality and Tourism Human Services Information Technology Law, Public Safety and Security Manufacturing Marketing, Sales and Service STEM Transportation, Distribution and Logistics 11
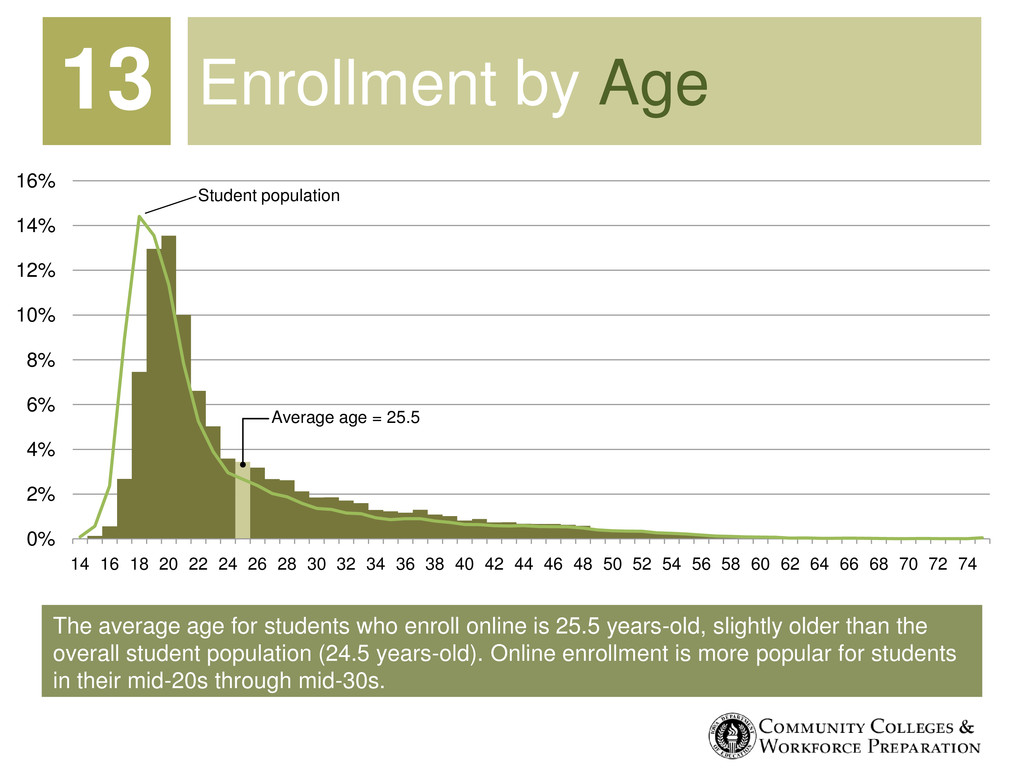
years-old, slightly older than the overall student population (24.5 years-old). Online enrollment is more popular for students in their mid-20s through mid-30s. Enrollment by Age 13 0% 2% 4% 6% 8% 10% 12% 14% 16% 14 16 18 20 22 24 26 28 30 32 34 36 38 40 42 44 46 48 50 52 54 56 58 60 62 64 66 68 70 72 74 Average age = 25.5 Student population
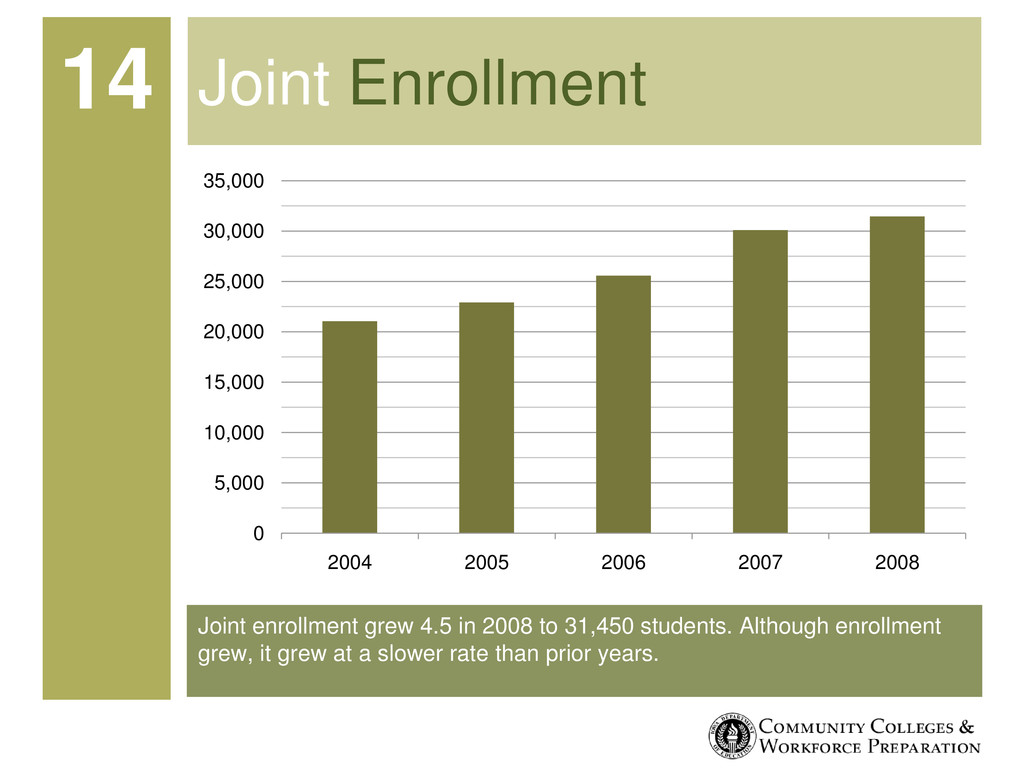
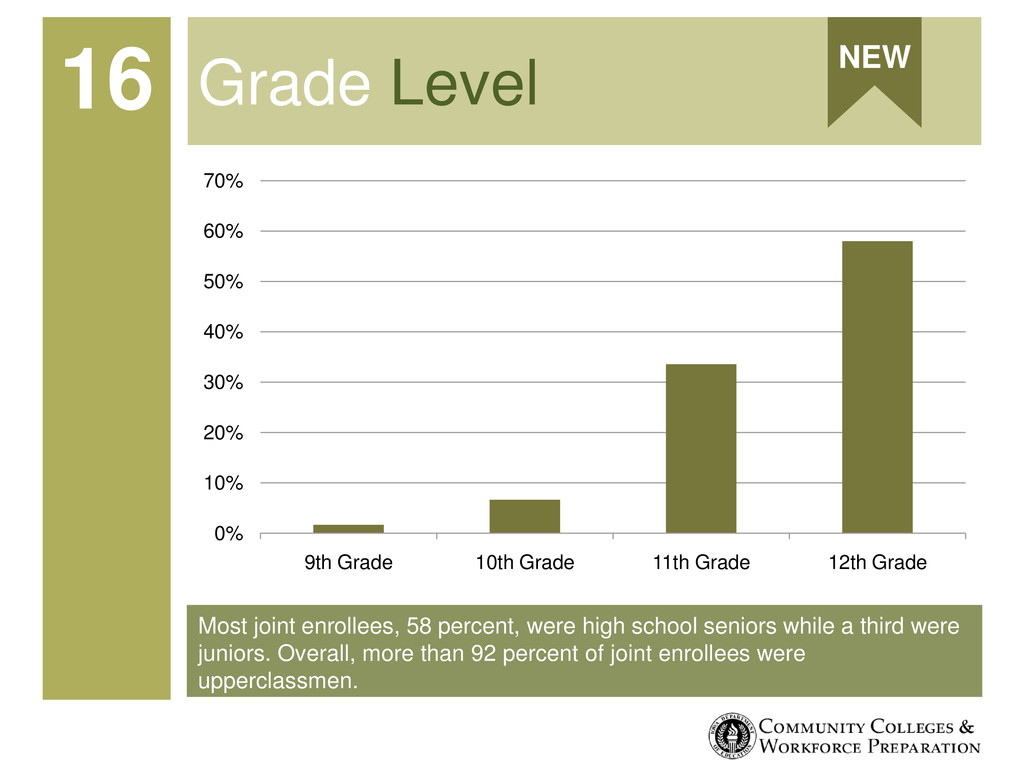
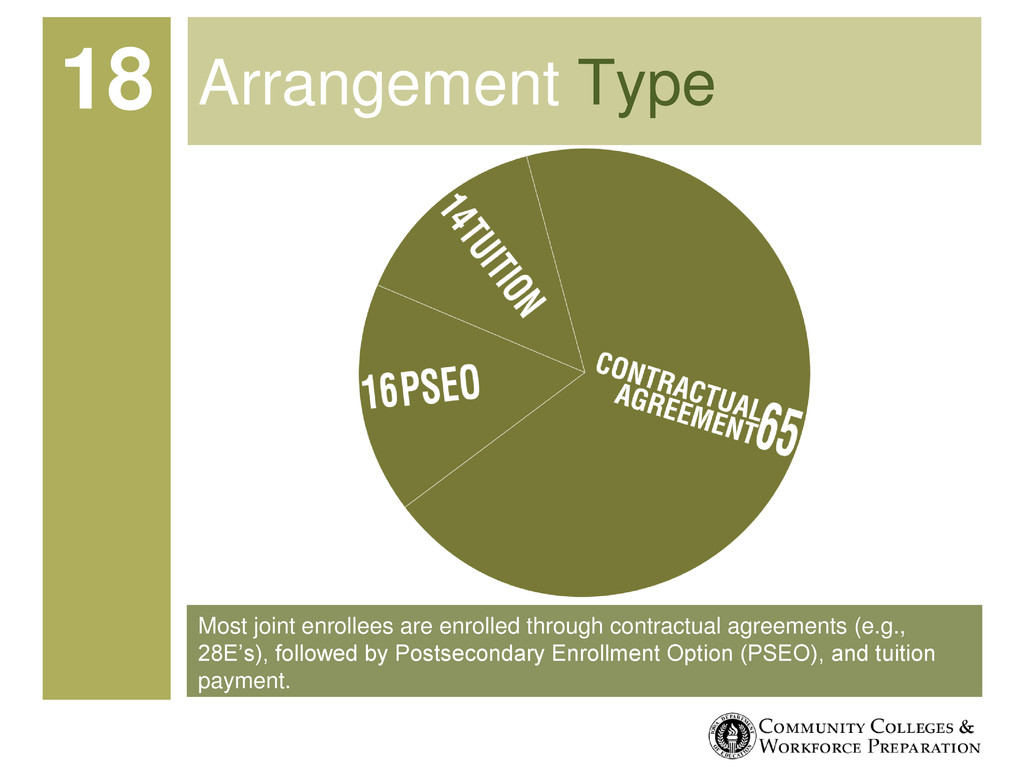
a third were juniors. Overall, more than 92 percent of joint enrollees were upperclassmen. Grade Level 16 0% 10% 20% 30% 40% 50% 60% 70% 9th Grade 10th Grade 11th Grade 12th Grade NEW
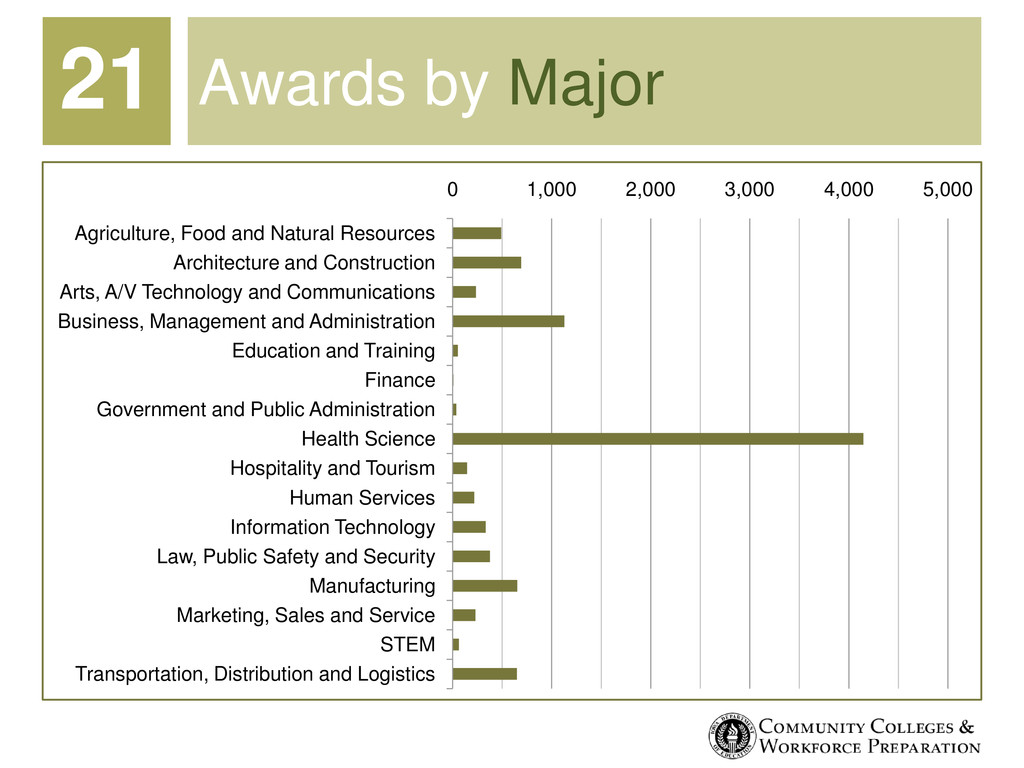
Food and Natural Resources Architecture and Construction Arts, A/V Technology and Communications Business, Management and Administration Education and Training Finance Government and Public Administration Health Science Hospitality and Tourism Human Services Information Technology Law, Public Safety and Security Manufacturing Marketing, Sales and Service STEM Transportation, Distribution and Logistics 21
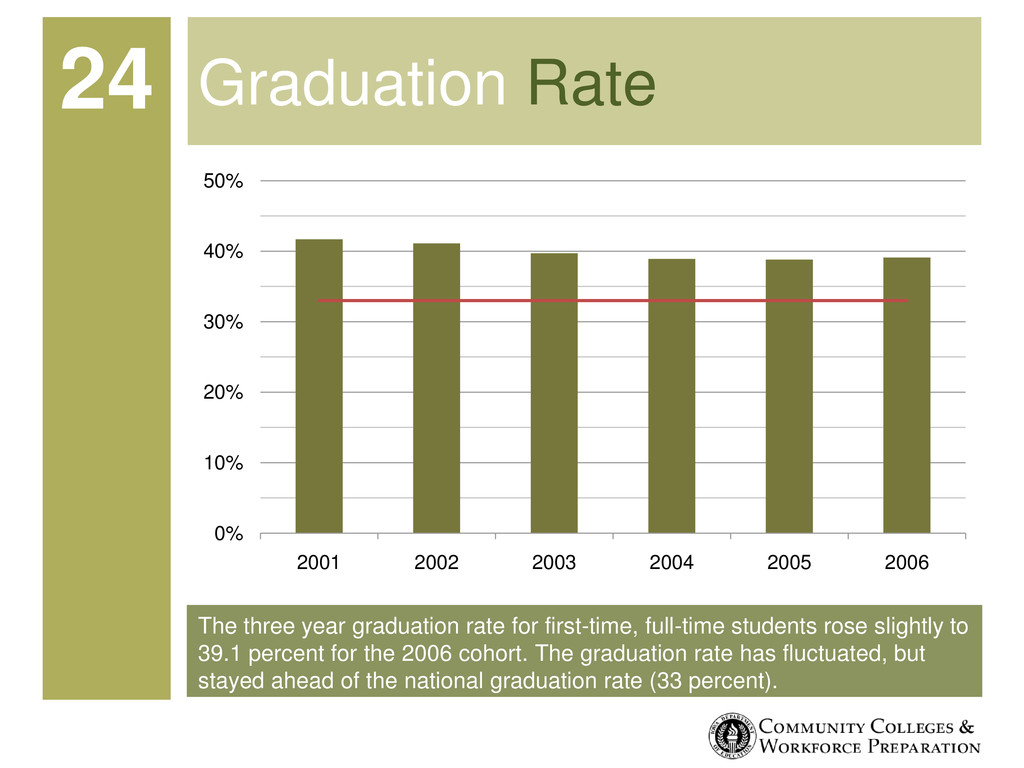
slightly to 39.1 percent for the 2006 cohort. The graduation rate has fluctuated, but stayed ahead of the national graduation rate (33 percent). Graduation Rate 24 0% 10% 20% 30% 40% 50% 2001 2002 2003 2004 2005 2006
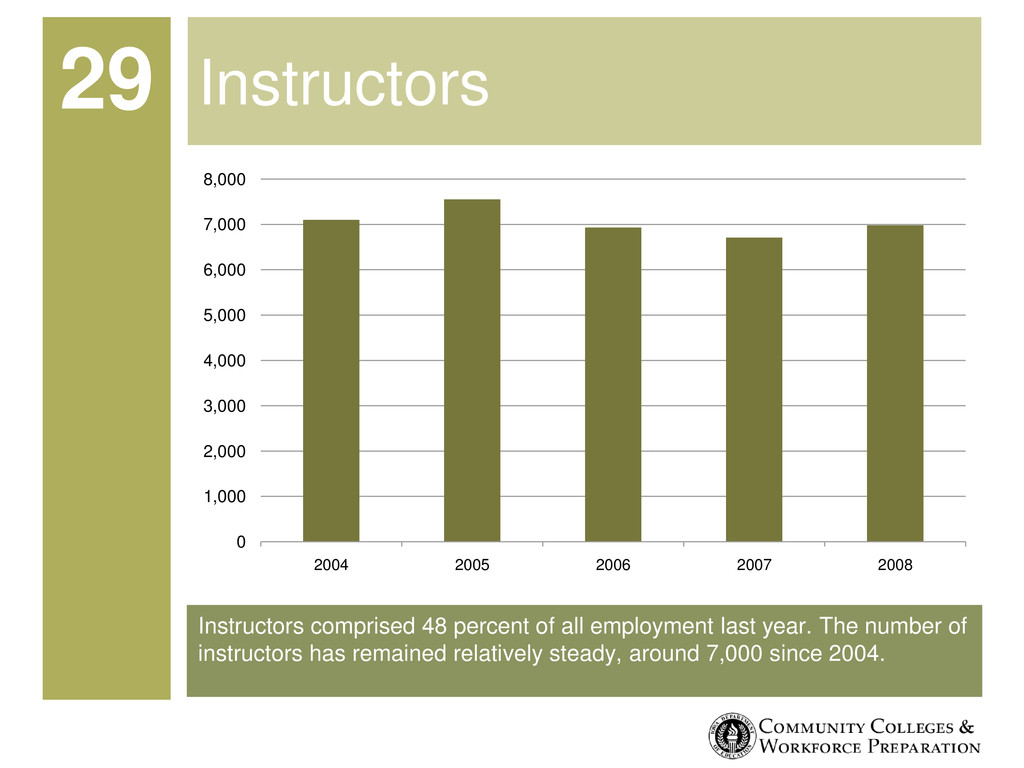
number of instructors has remained relatively steady, around 7,000 since 2004. Instructors 29 0 1,000 2,000 3,000 4,000 5,000 6,000 7,000 8,000 2004 2005 2006 2007 2008
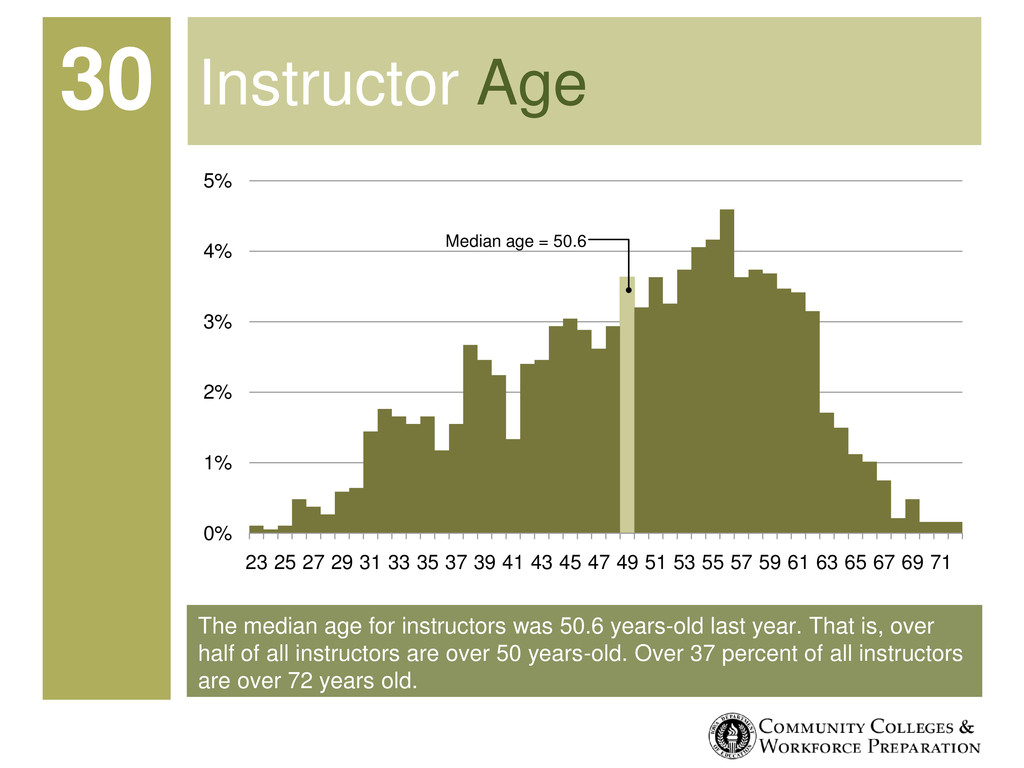
That is, over half of all instructors are over 50 years-old. Over 37 percent of all instructors are over 72 years old. Instructor Age 30 0% 1% 2% 3% 4% 5% 23 25 27 29 31 33 35 37 39 41 43 45 47 49 51 53 55 57 59 61 63 65 67 69 71 Median age = 50.6
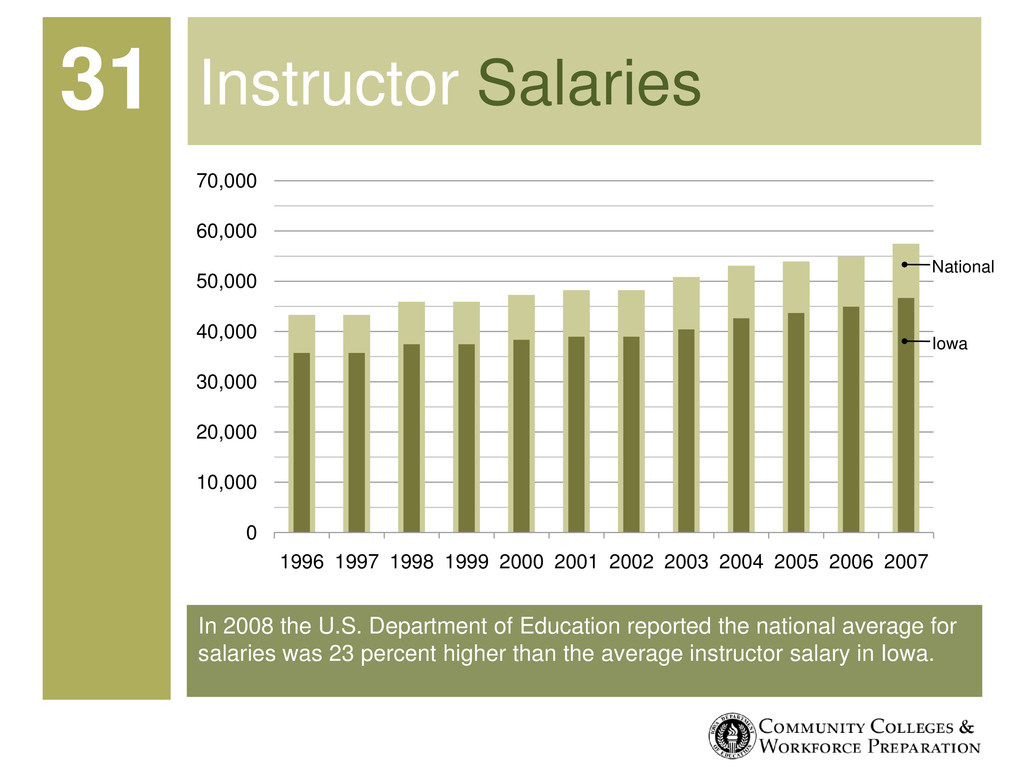
average for salaries was 23 percent higher than the average instructor salary in Iowa. Instructor Salaries 31 0 10,000 20,000 30,000 40,000 50,000 60,000 70,000 1996 1997 1998 1999 2000 2001 2002 2003 2004 2005 2006 2007 National Iowa