Upgrade to Pro — share decks privately, control downloads, hide ads and more …

Kickstarter by the Numbers

Kickstarter by the Numbers

Presented at CodeStock 2013

Michael C. Neel

July 12, 2013
Tweet

More Decks by Michael C. Neel

Other Decks in Business

Transcript

  1. Michael C. Neel

    View Slide

  2. What is Crowdfunding?

    View Slide

  3. What Crowdfunding is not

    View Slide

  4. Why Kickstarter?

    View Slide

  5. Video
    Short Desc
    Long Desc
    Rewards
    Bio
    Title
    FAQ
    Risks

    View Slide

  6. Kickstarter Stats

    View Slide

  7. Kickstarter Stats

    View Slide

  8. Kickstarter Stats

    View Slide

  9. We Must Go Deeper…

    View Slide

  10. Mike vs Kickstarter - Success
    Total $1,000 Raised $1,000 to $9,999 $10,000 to $19,999 $20,000 to $99,999 $100,000 to $999,999 $1,000,000+
    Art -0.4% -0.6% -0.3% -1.3% 0.0% 0.0% 0.0%
    Comics -0.6% -0.6% -0.8% 0.0% 0.0% 0.0% 0.0%
    Dance -0.2% -1.3% -0.1% 0.0% 0.0% 0.0% 0.0%
    Design -0.8% 0.0% -1.1% -1.1% -0.5% -0.8% 0.0%
    Fashion -0.7% -2.1% -0.2% -0.8% -2.1% 0.0% 0.0%
    Film & Video -0.8% -1.1% -0.9% -0.3% -0.7% 0.0% 0.0%
    Food -0.1% 0.0% -0.1% 0.0% -0.5% 0.0% 0.0%
    Games -1.2% -2.1% -1.4% -1.0% -0.5% -2.2% 0.0%
    Music -0.3% -0.5% -0.3% -0.3% -0.4% 0.0% 0.0%
    Photography -0.2% 0.0% -0.3% 0.0% 0.0% 0.0% 0.0%
    Publishing -0.5% -0.2% -0.4% -1.1% -1.0% 0.0% 0.0%
    Technology -0.3% 0.0% -0.4% 0.0% 0.0% -1.0% 0.0%
    Theater -0.4% -0.3% -0.5% 0.0% 0.0% 0.0% 0.0%
    Total -0.5% -0.6% -0.5% -0.5% -0.6% -0.9% 0.0%

    View Slide

  11. Mike vs Kickstarter - Failed
    Total 0% 1% to 20% 21% to 40% 41% to 60% 61% to 80% 81% to 99%
    Art -3.8% -15.1% 0.3% -4.7% -3.7% 0.0% -26.7%
    Comics -1.6% -13.9% 2.2% -7.1% 0.0% -7.1% 0.0%
    Dance -2.5% -13.4% 1.0% 0.0% -3.2% -16.7% 0.0%
    Design -1.8% -20.6% 1.1% -3.9% -3.8% 0.0% -3.7%
    Fashion -3.8% -14.4% 0.4% -6.7% -6.5% 0.0% -6.3%
    Film & Video -4.9% -17.2% -0.5% -4.8% -5.2% -4.9% -13.8%
    Food -1.9% -17.9% 0.6% -2.9% -9.2% 0.0% -14.3%
    Games -1.7% -20.8% 0.9% -2.5% -3.0% -11.3% -9.1%
    Music -5.1% -16.3% -0.9% -2.2% -6.8% -5.3% -9.8%
    Photography -3.5% -16.3% 1.7% -6.0% -1.3% -10.0% -18.2%
    Publishing -4.1% -14.1% -0.3% -4.5% -2.3% -6.1% -12.1%
    Technology -3.0% -23.4% 0.3% 0.0% -2.9% -18.2% -15.8%
    Theater -3.3% -12.3% 0.1% -4.2% -6.4% 0.0% -8.3%
    Total -4.0% -16.2% 0.0% -4.0% -4.6% -4.9% -12.3%

    View Slide

  12. Mike vs Kickstarter - Failed
    Total 01% to 20% 21% to 40% 41% to 60% 61% to 80% 81% to 99%
    Art -164 -130 9 -27 -8 0 -8
    Comics -20 -21 17 -14 0 -2 0
    Dance -9 -9 2 0 -1 -1 0
    Design -41 -35 16 -15 -6 0 -1
    Fashion -84 -65 5 -19 -4 0 -1
    Film & Video -722 -558 -50 -71 -26 -8 -9
    Food -38 -28 8 -7 -10 0 -1
    Games -55 -51 20 -9 -5 -7 -3
    Music -483 -365 -49 -28 -30 -7 -4
    Photography -65 -63 19 -15 -1 -3 -2
    Publishing -297 -241 -12 -30 -6 -4 -4
    Technology -40 -34 3 0 -2 -4 -3
    Theater -52 -38 1 -9 -5 0 -1
    Total -2070 -1638 -11 -244 -104 -36 -37

    View Slide

  13. Mike vs Kickstarter
    75000
    76000
    77000
    78000
    79000
    80000
    81000
    82000
    83000
    84000
    85000
    40%
    42%
    44%
    46%
    48%
    50%
    52%
    54%
    56%
    58%
    60%
    Sucessful Failed Total
    Kickstarter Mike

    View Slide

  14. 0
    1000
    2000
    3000
    4000
    5000
    6000
    7000
    8000
    9000
    10000
    0%
    10%
    20%
    30%
    40%
    50%
    60%
    70%
    80%
    90%
    100%
    2.7 7.2 12.5 16.5 21.5 26.9 30.4 36.3 41.1 45.6 51.3 57.3 60.2 66.6 71.5 76.5 81.9 88.1 90.3
    Project Success Rate Vs. Project Length
    Cr -0.8443
    R² 0.7128

    View Slide

  15. 0
    100
    200
    300
    400
    500
    600
    700
    800
    900
    1000
    0%
    10%
    20%
    30%
    40%
    50%
    60%
    70%
    80%
    90%
    100%
    3.5 7.1 12.6 16.1 21.4 27.0 30.3 36.0 41.0 45.4 51.7 56.9 60.1 66.2 71.0 76.4 83.0 87.9 90.2
    Video Game Project Success Rate Vs. Project Length
    Cr -0.0832
    R² 0.0069

    View Slide

  16. Video Game Project
    Success Rates Do Not
    Show A Correlation To
    Project Length
    Length Takeaway:

    View Slide

  17. 0
    1000
    2000
    3000
    4000
    5000
    6000
    7000
    8000
    9000
    10000
    0%
    10%
    20%
    30%
    40%
    50%
    60%
    70%
    80%
    90%
    100%
    Project Success Rate Vs. Project Goal (Under $100,000)
    Cr -0.8725
    R² 0.7612

    View Slide

  18. 0
    100
    200
    300
    400
    500
    600
    700
    800
    900
    1000
    0%
    10%
    20%
    30%
    40%
    50%
    60%
    70%
    80%
    90%
    100%
    Video Game Project Success Rate Vs. Project Goal (Under $100,000)
    Cr -0.4618
    R² 0.2132

    View Slide

  19. Video Game Project
    Success Rates Show A
    Weak Correlation To
    Project Goal (when goal
    is less than $100,000)
    Goal Takeaway:

    View Slide

  20. 0
    1000
    2000
    3000
    4000
    5000
    6000
    7000
    8000
    9000
    10000
    0%
    10%
    20%
    30%
    40%
    50%
    60%
    70%
    80%
    90%
    100%
    1 2 3 4 5 6 7 8 9 10 11 12 13 14 15 16 17 18 19 20
    Project Success Rate Vs. Number of Pledge Levels (Max 20)
    Cr 0.9509
    R² 0.9043

    View Slide

  21. 0
    100
    200
    300
    400
    500
    600
    700
    800
    900
    1000
    0%
    10%
    20%
    30%
    40%
    50%
    60%
    70%
    80%
    90%
    100%
    1 2 3 4 5 6 7 8 9 10 11 12 13 14 15 16 17 18 19 20
    Video Game Project Success Rate Vs. Number of Pledge Levels (Max 20)
    Cr 0.9043
    R² 0.8178

    View Slide

  22. Video Game Project
    Success Rates Show A
    Strong Correlation To
    Number of Pledge
    Levels (up to 20 levels)
    Pledge Level Takeaway:

    View Slide

  23. 0
    1000
    2000
    3000
    4000
    5000
    6000
    7000
    8000
    9000
    10000
    0%
    10%
    20%
    30%
    40%
    50%
    60%
    70%
    80%
    90%
    100%
    Project Success Rate Vs. Project About Length (HTML, Max 20,000 Chars)
    Cr 0.3693
    R² 0.1364

    View Slide

  24. 0
    100
    200
    300
    400
    500
    600
    700
    800
    900
    1000
    0%
    10%
    20%
    30%
    40%
    50%
    60%
    70%
    80%
    90%
    100%
    Video Game Project Success Rate Vs. Project About Length (HTML, Max 20,000 Chars)
    Cr 0.6453
    R² 0.4164

    View Slide

  25. Video Game Project
    Success Rates Show A
    Moderate Correlation To
    Length of About HTML
    About Length Takeaway:

    View Slide

  26. 0
    1000
    2000
    3000
    4000
    5000
    6000
    7000
    8000
    9000
    10000
    0%
    10%
    20%
    30%
    40%
    50%
    60%
    70%
    80%
    90%
    100%
    395
    458
    511
    673
    759
    851
    949
    1,046
    1,146
    1,248
    1,348
    1,449
    1,548
    1,644
    1,751
    1,846
    1,948
    2,047
    2,150
    2,247
    2,348
    2,447
    2,548
    2,649
    2,749
    2,850
    2,951
    3,052
    3,154
    3,248
    3,349
    3,446
    3,547
    3,652
    3,748
    3,844
    3,948
    4,050
    4,149
    4,244
    4,349
    4,452
    4,549
    4,644
    4,748
    4,849
    4,951
    Project Success Rate Vs. Project FAQ Length (HTML, Max 1,000 Chars)
    Cr 0.4337
    R² 0.1881

    View Slide

  27. 0
    100
    200
    300
    400
    500
    600
    700
    800
    900
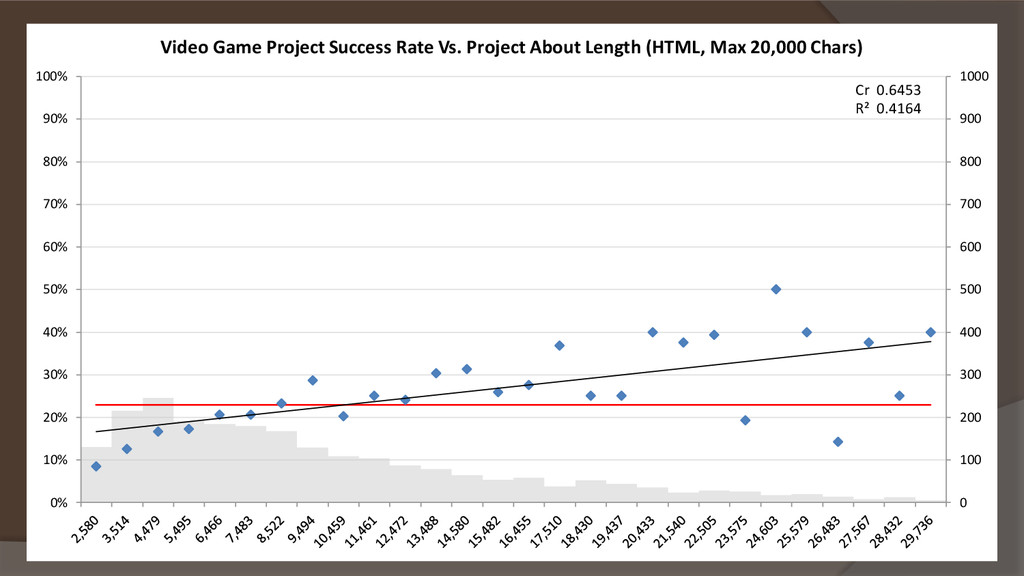
    1000
    0%
    10%
    20%
    30%
    40%
    50%
    60%
    70%
    80%
    90%
    100%
    396
    450
    518
    680
    760
    851
    950
    1,053
    1,152
    1,262
    1,346
    1,446
    1,544
    1,661
    1,760
    1,847
    1,940
    2,050
    2,156
    2,251
    2,346
    2,450
    2,543
    2,662
    2,750
    2,866
    2,957
    3,055
    3,147
    3,261
    3,334
    3,445
    3,558
    3,654
    3,734
    3,841
    3,940
    4,036
    4,144
    4,251
    4,348
    4,453
    4,568
    4,659
    4,749
    4,862
    4,940
    Video Game Project Success Rate Vs. Project FAQ Length (HTML, Max 1,000 Chars)
    Cr 0.5727
    R² 0.3280

    View Slide

  28. Video Game Project
    Success Rates Show A
    Moderate Correlation To
    Length of FAQ HTML
    FAQ Length Takeaway:

    View Slide

  29. 0
    300
    600
    900
    1200
    1500
    1800
    2100
    2400
    2700
    3000
    0%
    10%
    20%
    30%
    40%
    50%
    60%
    70%
    80%
    90%
    100%
    20 Day Moving Average Success Rate
    Project Count Video Game Project Count All Projects Video Games

    View Slide

  30. Because Mike Said So

    View Slide

  31. What Games Are A Good Fit?
     Desktop – No Mobile Only
     Windows 1st / Mac, Linux Help
     Not a “Simple Flash” Game
     No Free-To-Play
     Adventure / RPGs / Strategy
     Kickstarter is Pre-Orders

    View Slide

  32. Your Pitch Video, In Acts
     Act 1 – The Trailer, Concept Pitch
     Act 2 – Demo Gameplay
     Act 3 – You and Your Story
     Act 4 – What Kickstarter Funding Means
    for the Game
     Act 5 – Stretch Goals and Rewards

    View Slide

  33. You Are Not Tim Schafer

    View Slide

  34. Short Description: Clear and Simple

    View Slide

  35. Long Description
     Start with expanded short description
     List supported platforms / DRM early
     Videos, Music, Concept Art
     Pledge Reward Details
     Stretch Goals
     About Your Studio

    View Slide

  36. FAQ
     Reformatted Description
     Platforms, DRM, Release Date
     Reward Questions
     Reward Shipping
     System Requirements

    View Slide

  37. Reward Levels
     $71 is most popular pledge
    $50 for Video Games
     $25 is most popular reward tier
    $15 for Video Games

    View Slide

  38. Reward Ideas
     Digital Copy - $10
     “Special Edition” Digital Copy - $25
     Making Of Content
     Soundtrack
     Name in Credits / Character in Game
     Swag: T-Shirts, Stickers, Posters, Merch
     $10,000 – Suit of Real Armor

    View Slide

  39. Cost Breakdown - Rewards
     Include reward costs in goal!
     Calculate worst case:
    RC / RL x Goal = WC
    $25 / $50 x $1000 = $500
     Consider reward limits
     You will ship late

    View Slide

  40. Cost Breakdown
     The Banner Saga - $720k
     10% - Kickstarter, Amazon, Failed Charges
     $22K - Prizes
     $22K - Shipping ($10 Intl. not enough)
     Taxes - can be income but…
     No Taxes until the game ships!
    http://www.guenthertax.com/blog/2012/05/no-kickstarter-
    project-should-pay-income-tax-in-their-first-year/

    View Slide

  41. Pre Launch - Raising Awareness
     Social Networks
     Friends and Family
     Your Mailing List
     News Sites
     Bloggers
     Forums

    View Slide

  42. Post Launch – Content Updates
     Stretch Goals(?)
     Post Project Coverage
     Respond to Questions
     Reddit AMA
     Twitch.tv
     Non-stop Self Promotion

    View Slide

  43. Yay – You Made It!
     Plan Regular Updates to Backers
     Ship Physical Rewards Quickly
     Only One Survey On Kickstarter
     Point Backers to Steam Greenlight
     Setup Pre-Order Page for Late Comers
     The Double Dip?

    View Slide

  44. Oh No, Project Failed
     Figure out what went wrong
     “Programmer Art”?
     Not enough gameplay shown?
     Bad pitch video?
     Goal or Reward too high?
     Try again!

    View Slide

  45. Michael C. Neel
    [email protected]
    Vinull.com
    @ViNull
    GameMarx.com
    FuncWorks.com

    View Slide