Upgrade to Pro — share decks privately, control downloads, hide ads and more …

BMTC18: Welcome from Julia Herz of the Brewers Association

BMTC18: Welcome from Julia Herz of the Brewers Association

Julia provides a high-energy, fact-intensive overview of the current state of the beer industry with a specific focus on marketing and tourism. Not to be missed.

Zephyr Conferences

March 07, 2018
Tweet

More Decks by Zephyr Conferences

Other Decks in Research

Transcript

  1. 3/11/2018 1 Beer Breweries and Tourism Julia Herz| Brewers Association

    | @HerzMuses | @brewersassoc 1 Brewers Association Boulder, Colorado 2 Why? • Beer can be brewed ANYWHERE!! It’s LOCAL. • Beer can be brewed ANYTIME. Year round. • In Bev Alcohol Beer is top affordable luxury. • A brewery tour is an EXPERIENCE. • Tours let you taste living liquid history at the SOURCE. • Cause for other CAUSES • People and their stories 3 Economic Benefit • Great American Beer Festival • $29.3M impact • Transportation, food and beverages and hotels • Visit Denver-2017 • Oregon Brewers Festival • $19.4 million in direct spending and another $5.7 million in indirect spending. • Eastern Oregon University-2015 4
  2. 3/11/2018 2 Tourism and Beer • 10M+ people toured US

    craft brewers Ways to TOUR • Walk, Bike, Boat, Train, Car … Stories • Haunted, Famous, F2T, Veteran, Church, Schoolhouse … 5 How Craft Brewers Are Helping Revive Local Economies (On-line) Craft Brewers Give New Life To Cities Across U.S. (Print) 2/27/18 New York Times VT MT OR ME CO WY WA NH AK ID NM WI MI MN IADE IN NE PA NC SD CA VA MA CT OH IL DC NY MO ND HIKS RI AZ TN NV MD KY UT WV SC FL AR NJ TX AL GA OK LA MS 0 2 4 6 8 10 12 14 16 18 0 10 20 30 40 50 TTB Brewers Permits per 100,000 21+ adults (2016 pop) 6/30/2017 6/30/2016 2013 Sources: TTB, US Census Bureau, and Brewers Association U.S. Beer Market 8
  3. 3/11/2018 3 9 The U.S. is the #1 destination for

    beer on planet earth. Brewersassociation.org/WorkingGroup Alcoholic Beverage Sales Category Sales in billions BEER* $107.6 (2016) SPIRITS <$80 (estimated-2017) WINE $62.7 (2017) U.S. MARKET *$23.5B for Small and Independent Craft Brewers Brewersassociation.org/WorkingGroup The US Beer Market by Volume • Big 2 = 69% • Imports = 16% (estimated) • Craft = <13% (98% of the 6K+ breweries) • Others = 3% (estimated) from Pabst 3 share, + others
  4. 3/11/2018 4 Domestic Imports All figures in ‘000s of bbls

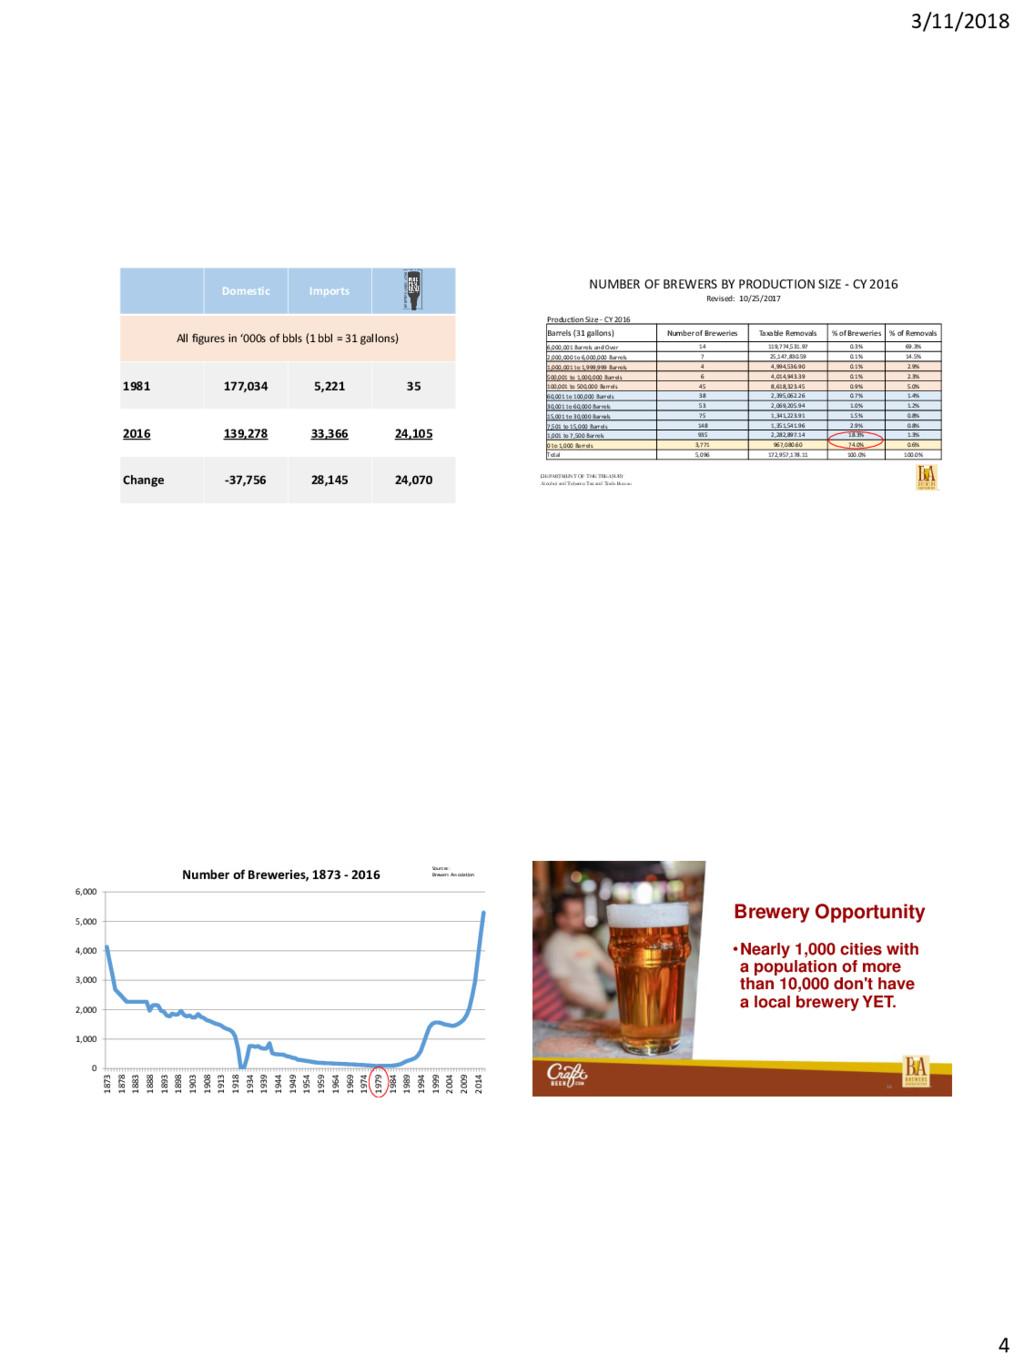
    (1 bbl = 31 gallons) 1981 177,034 5,221 35 2016 139,278 33,366 24,105 Change -37,756 28,145 24,070 DEPARTMENT OF THE TREASURY Alcohol and Tobacco Tax and Trade Bureau NUMBER OF BREWERS BY PRODUCTION SIZE - CY 2016 Revised: 10/25/2017 Production Size - CY 2016 Barrels (31 gallons) Number of Breweries Taxable Removals % of Breweries % of Removals 6,000,001 Barrels and Over 14 119,774,531.97 0.3% 69.3% 2,000,000 to 6,000,000 Barrels 7 25,147,830.59 0.1% 14.5% 1,000,001 to 1,999,999 Barrels 4 4,994,536.90 0.1% 2.9% 500,001 to 1,000,000 Barrels 6 4,014,943.39 0.1% 2.3% 100,001 to 500,000 Barrels 45 8,618,323.45 0.9% 5.0% 60,001 to 100,000 Barrels 38 2,395,062.26 0.7% 1.4% 30,001 to 60,000 Barrels 53 2,069,205.94 1.0% 1.2% 15,001 to 30,000 Barrels 75 1,341,223.91 1.5% 0.8% 7,501 to 15,000 Barrels 148 1,351,541.96 2.9% 0.8% 1,001 to 7,500 Barrels 935 2,282,897.14 18.3% 1.3% 0 to 1,000 Barrels 3,771 967,080.60 74.0% 0.6% Total 5,096 172,957,178.11 100.0% 100.0% 0 1,000 2,000 3,000 4,000 5,000 6,000 1873 1878 1883 1888 1893 1898 1903 1908 1913 1918 1934 1939 1944 1949 1954 1959 1964 1969 1974 1979 1984 1989 1994 1999 2004 2009 2014 Number of Breweries, 1873 - 2016 Sources: Brewers Association Brewery Opportunity •Nearly 1,000 cities with a population of more than 10,000 don't have a local brewery YET. 16
  5. 3/11/2018 5 0 2,000 4,000 6,000 8,000 10,000 12,000 14,000

    Bonded U.S. Wineries, 1993-2017 Dissecting Craft Data • On vs off premise – different animals • Hundreds if not thousands of breweries often not included in ‘craft’ sales. • Craft does not mean same craft to everyone. Qualify. • Scan data for your region – UPC code is a snapshot. Who is the Beer Lover? • Beer Beginner, Beer Enthusiast, Beer Geek • Male / Female • Young / Mature • Dedicated beer / Cross Drinker Beer and Tourism 19
  6. 3/11/2018 6 • In the 2016 Travelocity Beer Tourism Index

    ¾+ of 1,003 said they would like to go on a trip where they visited craft breweries and sampled local beer. • 10+million toured craft breweries in 2014. ½+ who toured were from outside the destination. Some Stats To SIP On 24
  7. 3/11/2018 7 53.0% 27.2% 9.1% 6.8% 4.0% 0.0% 10.0% 20.0%

    30.0% 40.0% 50.0% 60.0% 0 1 or 2 3 to 5 6 to 9 10+ How many, if any, craft breweries have you visited while traveling in the past 12 months? Source: Nielsen CIP Brewersassociation.org/WorkingGroup Economic Contributions of Craft Brewers *Source: 2016 Brewers Association • $67.8 billion* • Up 21.7% from 2014 • 456,373 jobs (3-tiers) * • Up 7.5% from 2014 • 129,000 Full/Part time (direct) Brewersassociation.org/WorkingGroup
  8. 3/11/2018 8 How important is “local” in purchase decisions? 67

    45 34 23 71 53 34 25 0 20 40 60 80 Craft Beer Wine Spirits Nielsen Surveys: Sum of very/somewhat important Total 21+ 21-34 Source: Nielsen Quick Query Omnibus Survey, 12-17, 2015. (Base: LDA consumers who drink at least several times per year) Brewery Tap Rooms 30 Brewersassociation.org/WorkingGroup Sales Channels ALL Beer ON-PREMISES 30% 18% OFF-PREMISES 60% 82% AT THE BREWERY 10% <1% Source: 2017 Brewer Association A New Sales Channel Q: As you have visited a Brewpub/Taproom or Brewery in the last 3 months, did that visit replace a visit to a bar or other on-premise establishment? (If you visited multiple breweries, please select the option that is most typical)
  9. 3/11/2018 9 Brewery Tap Rooms Are The SOLUTION • Tasting

    Rooms drive beer lover interest – HALO for brands. • Tasting Rooms are sourcing NEW beer sales that did not exist before. • At the source is great bet for beer experience • Glassware, beer clean glass, fresh beer, clean draught lines and informed servers After your visit(s) to a craft brewery, which of the following describe how, if at all, your purchasing habits of that craft brewer’s products changed? 0.0% 10.0% 20.0% 30.0% 40.0% 50.0% 60.0% 70.0% Daily More than Weekly Weekly More than Monthly Monthly A few Times a Year Purchased a little or a lot more of that craft brewers products 34 The Importance of Guilds
  10. 3/11/2018 11 Homebrewing in U.S. • 1.1M+ U.S. homebrewers •

    More than 1.4M barrels of beer a year • 1,700+ Clubs • 700+ Retailers • BJCP Competitions 724 in 2017 vs. 192 in 2003 • 46,000 members of AHA HomebrewersAssociation.org 41 Copyright ©2016 Nielsen CGA. Confidential and proprietary. Consumption of craft beer is biased toward eating occasions % drinking craft beer for occasion type Source: Nielsen CGA On Premise User Survey (March-April 2017) – sample size: 3082 31% 49% 20% Food-led occasions Drink-led occasions Q: On which occasions do you typically drink craft beer? 42 • Self Distribution • Franchise Laws • Growler Laws • State Excise Tax Rates • Brewery Sales and Sampling Laws 43 Laws and Positions U.S. Craft Brewer Defined •Small •Independent •Traditional 98% of today’s 6,000+ U.S. breweries 44