Upgrade to Pro — share decks privately, control downloads, hide ads and more …

Déployer et monitorer Elasticsearch sur Google Cloud Platform: GDG Lille

Elastic Co
December 14, 2017

Déployer et monitorer Elasticsearch sur Google Cloud Platform: GDG Lille

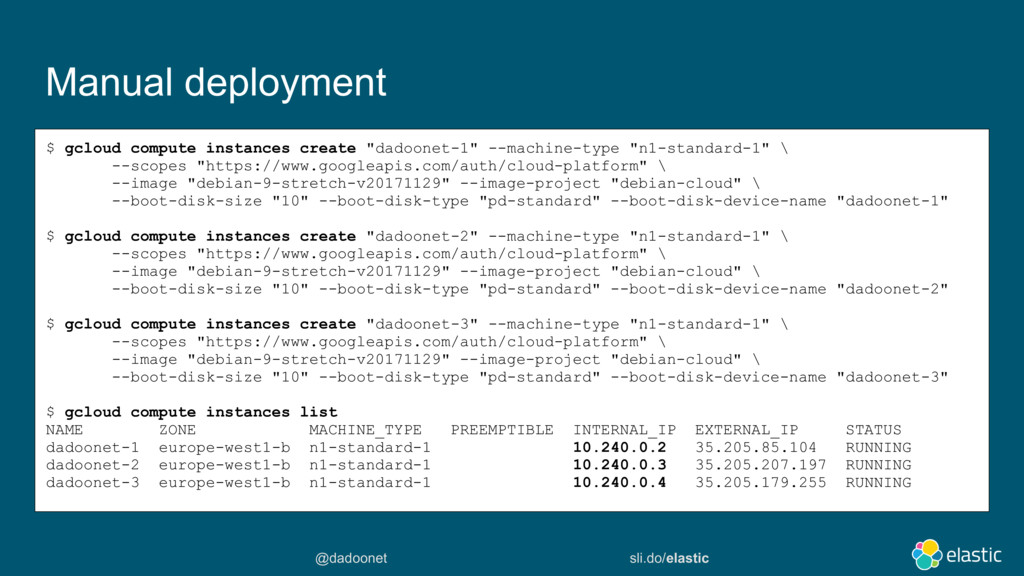
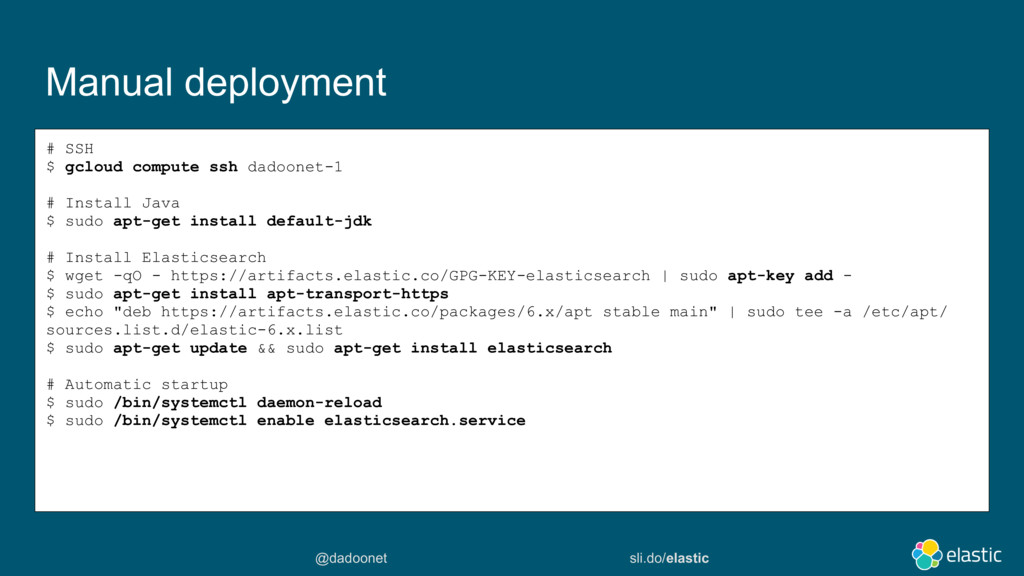
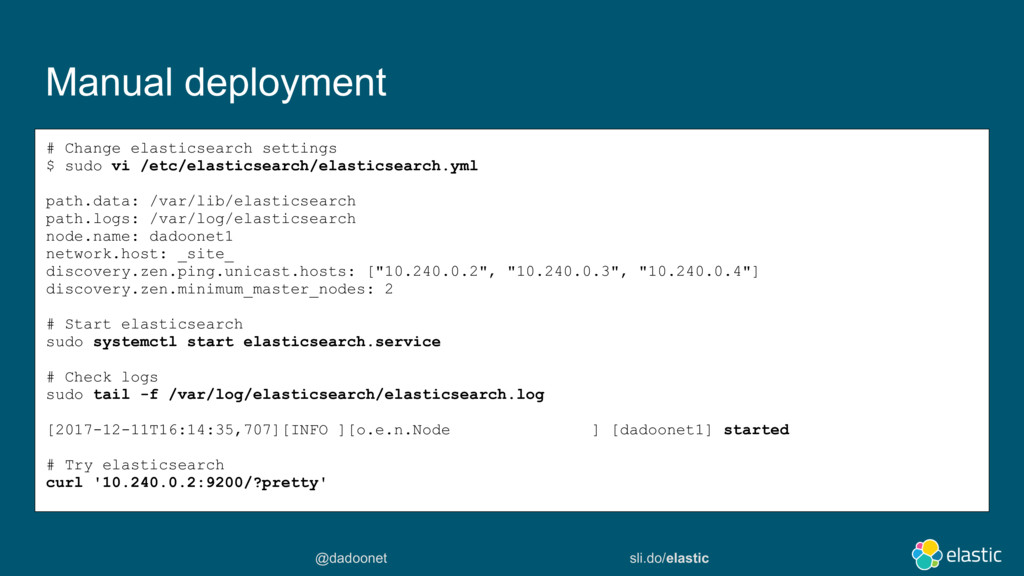
Pour déployer elasticsearch sur Google Compute Platform, plusieurs options s'offrent à vous :
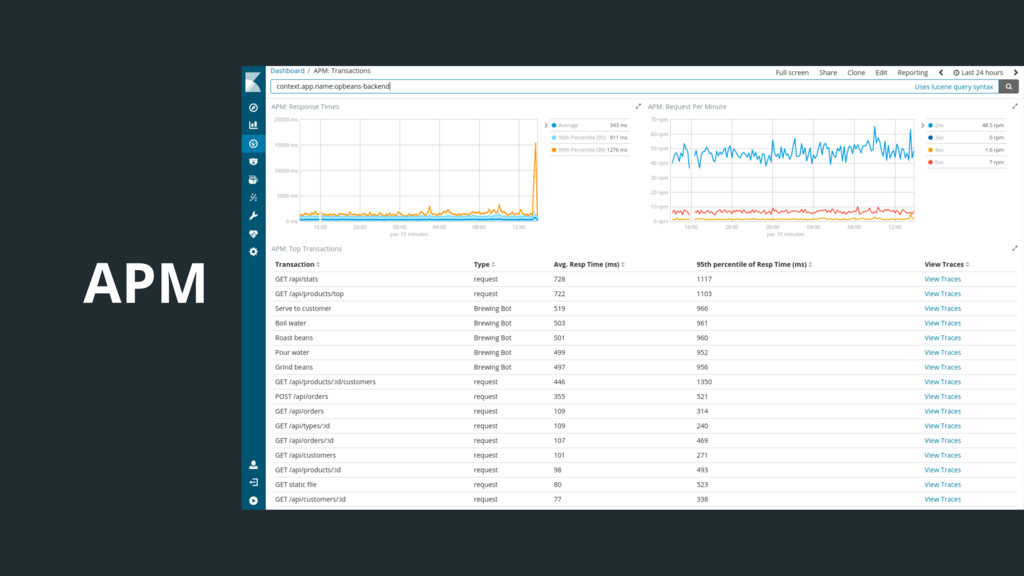
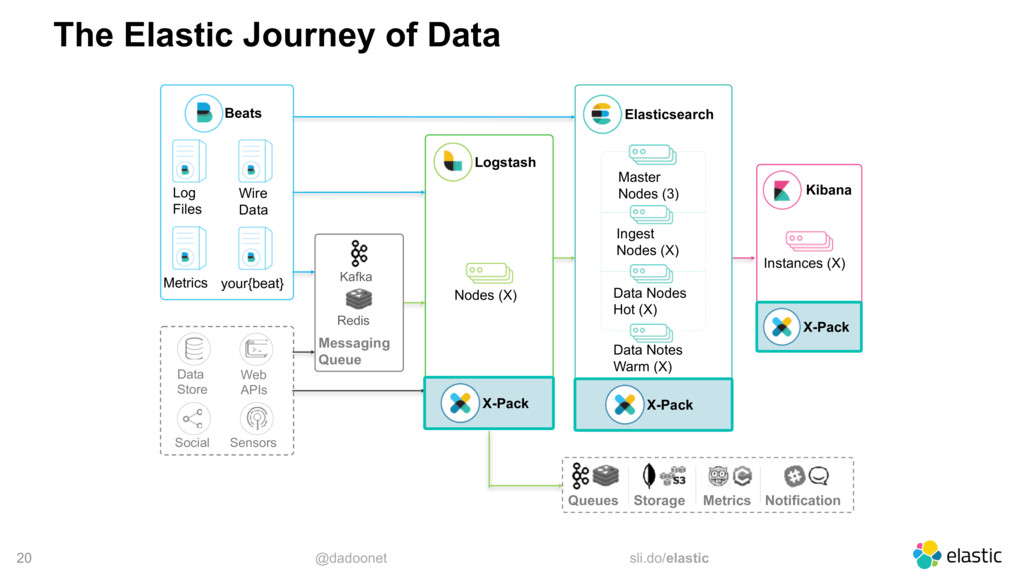
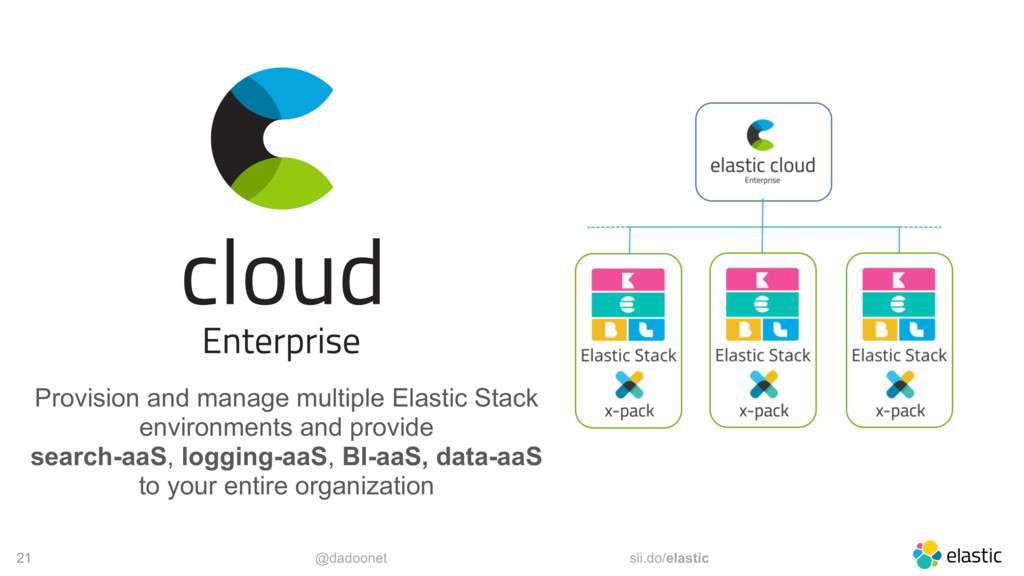
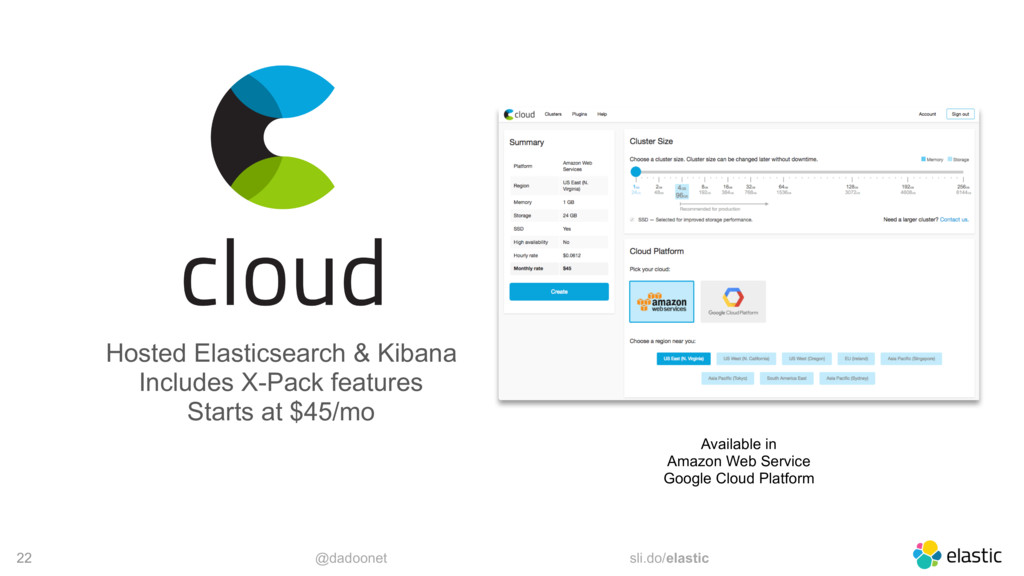
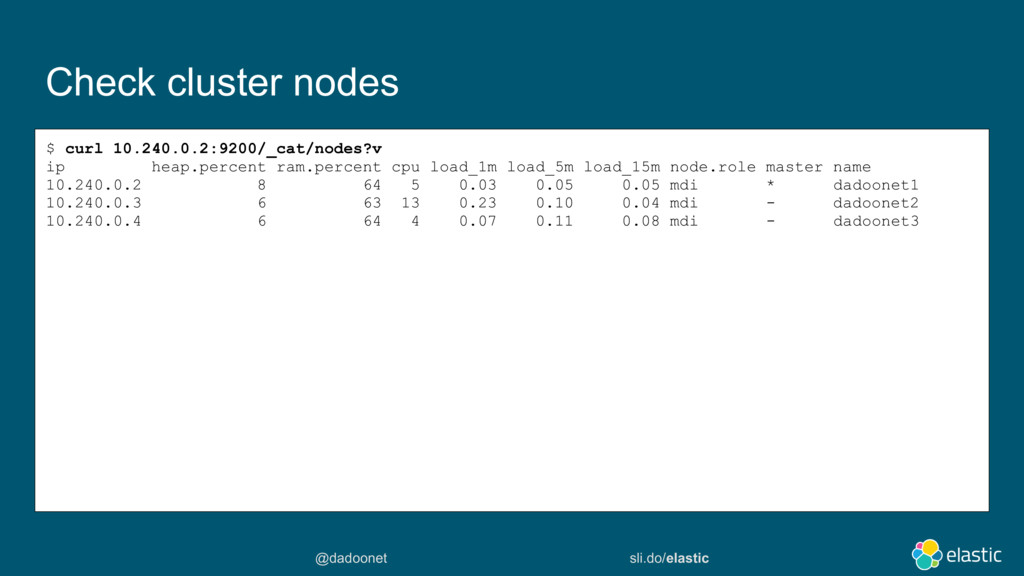
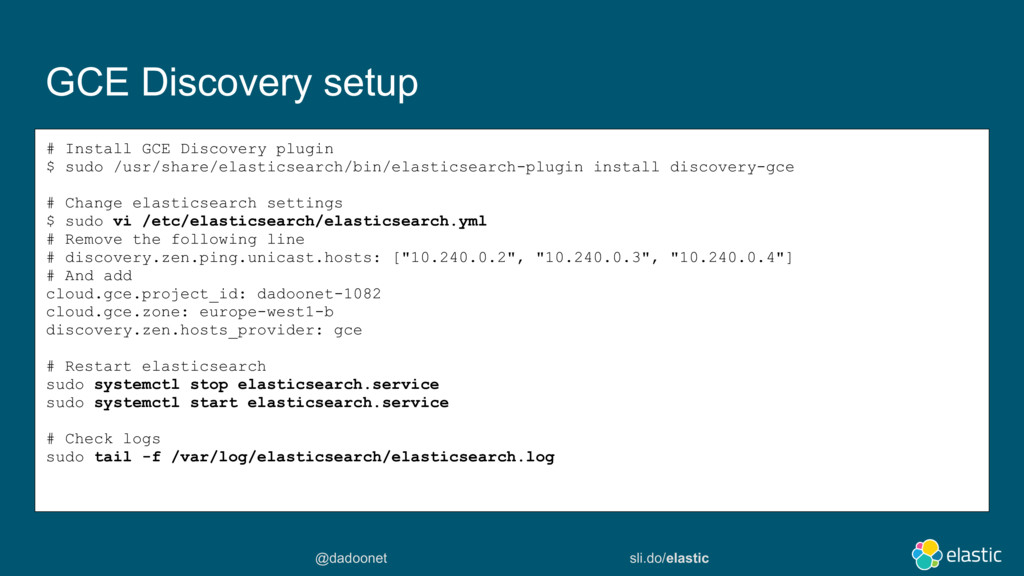
Démarrer des instances GCE, installer et configurer elasticsearch pour le discoveryIdem mais installer le plugin discovery-gce qui vous simplifiera la découverte des noeudsPuis installer X-Pack basic pour monitorer les ressources.Utiliser Elastic Cloud Entreprise et le déployer sur des instances GCELaisser elastic la société, déployer et manager vos instances sur GCP via cloud.elastic.co (http://cloud.elastic.co/)
Ce talk vous décrira ces différentes options disponibles ainsi que quelques trucs et astuces pour optimiser au mieux votre usage d'elasticsearch quelque soit le mode de déploiement.

Elastic Co

December 14, 2017
Tweet

More Decks by Elastic Co

Other Decks in Technology

Transcript

  1. @dadoonet sli.do/elastic 5 Agenda Data Platform Architectures Deploying on Google

    platform Elasticsearch Cluster Sizing Optimal Bulk Size 1 2 3 4 5 Distribute the Load 6 Optimizing Disk IO 7 Final Remarks
  2. APM

  3. @dadoonet sli.do/elastic 20 The Elastic Journey of Data Beats Log

    Files Metrics Wire Data your{beat} Data Store Web APIs Social Sensors Elasticsearch Master Nodes (3) Ingest Nodes (X) Data Nodes Hot (X) Data Notes Warm (X) Logstash Nodes (X) Kafka Redis Messaging Queue Kibana Instances (X) Notification Queues Storage Metrics X-Pack X-Pack X-Pack
  4. @dadoonet sli.do/elastic 21 Provision and manage multiple Elastic Stack environments

    and provide search-aaS, logging-aaS, BI-aaS, data-aaS to your entire organization
  5. @dadoonet sli.do/elastic 22 Hosted Elasticsearch & Kibana Includes X-Pack features

    Starts at $45/mo Available in Amazon Web Service Google Cloud Platform
  6. @dadoonet sli.do/elastic 29 Deploying beats Packetbeat Metricbeat Filebeat Packetbeat Metricbeat

    Filebeat Heartbeat Heartbeat Elasticsearch Master Nodes (3) Ingest Nodes (X) Data Nodes Hot (X) Data Notes Warm (X)
  7. @dadoonet sli.do/elastic 30 Elastic Platform Beats Log Files Metrics Wire

    Data your{beat} Data Store Web APIs Social Sensors Elasticsearch Master Nodes (3) Ingest Nodes (X) Data Nodes Hot (X) Data Notes Warm (X) Logstash Nodes (X) Kafka Redis Messaging Queue Kibana Instances (X) Notification Queues Storage Metrics
  8. @dadoonet sli.do/elastic 31 Elastic Platform Beats Log Files Metrics Wire

    Data your{beat} Data Store Web APIs Social Sensors Elasticsearch Master Nodes (3) Ingest Nodes (X) Data Nodes Hot (X) Data Notes Warm (X) Logstash Nodes (X) Kafka Redis Messaging Queue Kibana Instances (X) Notification Queues Storage Metrics
  9. @dadoonet sli.do/elastic Manual deployment $ gcloud compute instances create "dadoonet-1"

    --machine-type "n1-standard-1" \ --scopes "https://www.googleapis.com/auth/cloud-platform" \ --image "debian-9-stretch-v20171129" --image-project "debian-cloud" \ --boot-disk-size "10" --boot-disk-type "pd-standard" --boot-disk-device-name "dadoonet-1" $ gcloud compute instances create "dadoonet-2" --machine-type "n1-standard-1" \ --scopes "https://www.googleapis.com/auth/cloud-platform" \ --image "debian-9-stretch-v20171129" --image-project "debian-cloud" \ --boot-disk-size "10" --boot-disk-type "pd-standard" --boot-disk-device-name "dadoonet-2" $ gcloud compute instances create "dadoonet-3" --machine-type "n1-standard-1" \ --scopes "https://www.googleapis.com/auth/cloud-platform" \ --image "debian-9-stretch-v20171129" --image-project "debian-cloud" \ --boot-disk-size "10" --boot-disk-type "pd-standard" --boot-disk-device-name "dadoonet-3" $ gcloud compute instances list NAME ZONE MACHINE_TYPE PREEMPTIBLE INTERNAL_IP EXTERNAL_IP STATUS dadoonet-1 europe-west1-b n1-standard-1 10.240.0.2 35.205.85.104 RUNNING dadoonet-2 europe-west1-b n1-standard-1 10.240.0.3 35.205.207.197 RUNNING dadoonet-3 europe-west1-b n1-standard-1 10.240.0.4 35.205.179.255 RUNNING
  10. @dadoonet sli.do/elastic Manual deployment # SSH $ gcloud compute ssh

    dadoonet-1 # Install Java $ sudo apt-get install default-jdk # Install Elasticsearch $ wget -qO - https://artifacts.elastic.co/GPG-KEY-elasticsearch | sudo apt-key add - $ sudo apt-get install apt-transport-https $ echo "deb https://artifacts.elastic.co/packages/6.x/apt stable main" | sudo tee -a /etc/apt/ sources.list.d/elastic-6.x.list $ sudo apt-get update && sudo apt-get install elasticsearch # Automatic startup $ sudo /bin/systemctl daemon-reload $ sudo /bin/systemctl enable elasticsearch.service
  11. @dadoonet sli.do/elastic Manual deployment # Change elasticsearch settings $ sudo

    vi /etc/elasticsearch/elasticsearch.yml path.data: /var/lib/elasticsearch path.logs: /var/log/elasticsearch node.name: dadoonet1 network.host: _site_ discovery.zen.ping.unicast.hosts: ["10.240.0.2", "10.240.0.3", "10.240.0.4"] discovery.zen.minimum_master_nodes: 2 # Start elasticsearch sudo systemctl start elasticsearch.service # Check logs sudo tail -f /var/log/elasticsearch/elasticsearch.log [2017-12-11T16:14:35,707][INFO ][o.e.n.Node ] [dadoonet1] started # Try elasticsearch curl '10.240.0.2:9200/?pretty'
  12. @dadoonet sli.do/elastic Check cluster nodes $ curl 10.240.0.2:9200/_cat/nodes?v ip heap.percent

    ram.percent cpu load_1m load_5m load_15m node.role master name 10.240.0.2 8 64 5 0.03 0.05 0.05 mdi * dadoonet1 10.240.0.3 6 63 13 0.23 0.10 0.04 mdi - dadoonet2 10.240.0.4 6 64 4 0.07 0.11 0.08 mdi - dadoonet3
  13. @dadoonet sli.do/elastic GCE Discovery setup # Install GCE Discovery plugin

    $ sudo /usr/share/elasticsearch/bin/elasticsearch-plugin install discovery-gce # Change elasticsearch settings $ sudo vi /etc/elasticsearch/elasticsearch.yml # Remove the following line # discovery.zen.ping.unicast.hosts: ["10.240.0.2", "10.240.0.3", "10.240.0.4"] # And add cloud.gce.project_id: dadoonet-1082 cloud.gce.zone: europe-west1-b discovery.zen.hosts_provider: gce # Restart elasticsearch sudo systemctl stop elasticsearch.service sudo systemctl start elasticsearch.service # Check logs sudo tail -f /var/log/elasticsearch/elasticsearch.log
  14. @dadoonet sli.do/elastic 39 Elastic Platform Beats Log Files Metrics Wire

    Data your{beat} Data Store Web APIs Social Sensors Elasticsearch Master Nodes (3) Ingest Nodes (X) Data Nodes Hot (X) Data Notes Warm (X) Logstash Nodes (X) Kafka Redis Messaging Queue Kibana Instances (X) Notification Queues Storage Metrics
  15. @dadoonet sli.do/elastic Manual deployment # Create a firewall rule $

    gcloud compute firewall-rules create kibana --direction=INGRESS --priority=1000 \ --network=default --action=ALLOW --rules=tcp:5601 --source-ranges=0.0.0.0/0 \ --target-tags=kibana # Create Kibana GCE Instance $ gcloud compute instances create "dadoonet-k" --machine-type "n1-standard-1" \ --scopes "https://www.googleapis.com/auth/cloud-platform" --tags "kibana" \ --image "debian-9-stretch-v20171129" --image-project "debian-cloud" \ --boot-disk-size "10" --boot-disk-type "pd-standard" --boot-disk-device-name "dadoonet-k" $ gcloud compute instances list NAME ZONE MACHINE_TYPE PREEMPTIBLE INTERNAL_IP EXTERNAL_IP STATUS dadoonet-1 europe-west1-b n1-standard-1 10.240.0.2 35.205.85.104 RUNNING dadoonet-2 europe-west1-b n1-standard-1 10.240.0.3 35.205.207.197 RUNNING dadoonet-3 europe-west1-b n1-standard-1 10.240.0.4 35.205.179.255 RUNNING dadoonet-k europe-west1-b n1-standard-1 10.240.0.5 35.195.167.220 RUNNING
  16. @dadoonet sli.do/elastic Manual deployment # SSH $ gcloud compute ssh

    dadoonet-k # Install Elasticsearch $ wget -qO - https://artifacts.elastic.co/GPG-KEY-elasticsearch | sudo apt-key add - $ sudo apt-get install apt-transport-https $ echo "deb https://artifacts.elastic.co/packages/6.x/apt stable main" | sudo tee -a /etc/apt/ sources.list.d/elastic-6.x.list $ sudo apt-get update && sudo apt-get install kibana # Automatic startup $ sudo /bin/systemctl daemon-reload $ sudo /bin/systemctl enable kibana.service
  17. @dadoonet sli.do/elastic Manual deployment # Change kibana settings $ sudo

    vi /etc/kibana/kibana.yml server.host: "10.240.0.5" elasticsearch.url: "http://10.240.0.2:9200" # Start elasticsearch sudo systemctl start kibana.service # Check logs sudo journalctl -f
  18. @dadoonet sli.do/elastic 45 Elastic Platform Beats Log Files Metrics Wire

    Data your{beat} Data Store Web APIs Social Sensors Elasticsearch Master Nodes (3) Ingest Nodes (X) Data Nodes Hot (X) Data Notes Warm (X) Logstash Nodes (X) Kafka Redis Messaging Queue Kibana Instances (X) Notification Queues Storage Metrics
  19. @dadoonet sli.do/elastic 50 Terminology Cluster my_cluster Server 1 Node A

    d1 d2 d3 d4 d5 d6 d7 d8 d9 d10 d11 d12 Index twitter d6 d3 d2 d5 d1 d4 Index logs
  20. @dadoonet sli.do/elastic 51 Partition Cluster my_cluster Server 1 Node A

    d1 d2 d3 d4 d5 d6 d7 d8 d9 d10 d11 d12 Index twitter d6 d3 d2 d5 d1 d4 Index logs Shards 0 1 4 2 3 0 1
  21. @dadoonet sli.do/elastic 52 Distribution Cluster my_cluster Server 1 Node A

    Server 2 Node B twitter shard P4 d1 d2 d6 d5 d10 d12 twitter shard P2 twitter shard P1 logs shard P0 d2 d5 d4 logs shard P1 d3 d4 d9 d7 d8 d11 twitter shard P3 twitter shard P0 d6 d3 d1
  22. @dadoonet sli.do/elastic 53 Replication Cluster my_cluster Server 1 Node A

    Server 2 Node B twitter shard P4 d1 d2 d6 d5 d10 d12 twitter shard P2 twitter shard P1 logs shard P0 d2 d5 d4 logs shard P1 d3 d4 d9 d7 d8 d11 twitter shard P3 twitter shard P0 twitter shard R4 d1 d2 d6 d12 twitter shard R2 d5 d10 twitter shard R1 d6 d3 d1 d6 d3 d1 logs shard R0 d2 d5 d4 logs shard R1 d3 d4 d9 d7 d8 d11 twitter shard R3 twitter shard R0 • Primaries • Replicas
  23. @dadoonet sli.do/elastic 58 Scaling • In Elasticsearch, shards are the

    working unit • More data -> More shards Big Data ... ... But how many shards?
  24. @dadoonet sli.do/elastic 59 How much data? • ~1000 events per

    second • 60s * 60m * 24h * 1000 events => ~87M events per day • 1kb per event => ~82GB per day • 3 months => ~7TB
  25. @dadoonet sli.do/elastic 60 Shard Size • It depends on many

    different factors ‒ document size, mapping, use case, kinds of queries being executed, desired response time, peak indexing rate, budget, ... • After the shard sizing*, each shard should handle 45GB • Up to 10 shards per machine * https://www.elastic.co/elasticon/conf/2016/sf/quantitative-cluster-sizing
  26. @dadoonet sli.do/elastic 61 How many shards? • Data size: ~7TB

    • Shard Size: ~45GB* • Total Shards: ~160 • Shards per machine: 10* • Total Servers: 16 * https://www.elastic.co/elasticon/conf/2016/sf/quantitative-cluster-sizing Cluster my_cluster 3 months of logs ...
  27. @dadoonet sli.do/elastic 62 But... • How many indices? • What

    do you do if the daily data grows? • What do you do if you want to delete old data?
  28. @dadoonet sli.do/elastic 63 Time-Based Data • Logs, social media streams,

    time-based events • Timestamp + Data • Do not change • Typically search for recent events • Older documents become less important • Hard to predict the data size
  29. @dadoonet sli.do/elastic 64 Time-Based Data • Time-based Indices is the

    best option ‒ create a new index each day, week, month, year, ... ‒ search the indices you need in the same request
  30. @dadoonet sli.do/elastic 67 Daily Indices Cluster my_cluster d6 d3 d2

    d5 d1 d4 logs-2017-10-06 d6 d3 d2 d5 d1 d4 logs-2017-10-08 d6 d3 d2 d5 d1 d4 logs-2017-10-07
  31. @dadoonet sli.do/elastic 68 Templates • Every new created index starting

    with 'logs-' will have ‒ 2 shards ‒ 1 replica (for each primary shard) ‒ 60 seconds refresh interval PUT _template/logs { "template": "logs-*", "settings": { "number_of_shards": 2, "number_of_replicas": 1, "refresh_interval": "60s" } } More on that later
  32. @dadoonet sli.do/elastic 69 Alias Cluster my_cluster d6 d3 d2 d5

    d1 d4 logs-2017-10-06 users Application logs-write logs-read
  33. @dadoonet sli.do/elastic 70 Alias Cluster my_cluster d6 d3 d2 d5

    d1 d4 logs-2017-10-06 users Application logs-write logs-read d6 d3 d2 d5 d1 d4 logs-2017-10-07
  34. @dadoonet sli.do/elastic 71 Alias Cluster my_cluster d6 d3 d2 d5

    d1 d4 logs-2017-10-06 users Application logs-write logs-read d6 d3 d2 d5 d1 d4 logs-2017-10-07 d6 d3 d2 d5 d1 d4 logs-2017-10-08
  35. @dadoonet sli.do/elastic 73 Do not Overshard • 3 different logs

    • 1 index per day each • 1GB each • 5 shards (default): so 200mb / shard vs 45gb • 6 months retention • ~900 shards for ~180GB • we needed ~4 shards! don't keep default values! Cluster my_cluster access-... d6 d3 d2 d5 d1 d4 application-... d6 d5 d9 d5 d1 d7 mysql-... d10 d59 d3 d5 d0 d4
  36. @dadoonet sli.do/elastic 80 Shards are the working unit • Primaries

    ‒ More data -> More shards ‒ write throughput (More writes -> More primary shards) • Replicas ‒ high availability (1 replica is the default) ‒ read throughput (More reads -> More replicas)
  37. @dadoonet sli.do/elastic 82 What is Bulk? Elasticsearch Master Nodes (3)

    Ingest Nodes (X) Data Nodes Hot (X) Data Notes Warm (X) X-Pack __________ __________ __________ __________ __________ __________ __________ __________ __________ __________ __________ __________ __________ __________ __________ __________ __________ __________ __________ __________ __________ __________ __________ __________ __________ __________ __________ __________ __________ __________ __________ __________ __________ __________ __________ __________ __________ __________ __________ __________ _____ 1000
 log events Beats Logstash Application 1000 index requests with 1 document 1 bulk request with 1000 documents
  38. @dadoonet sli.do/elastic 83 What is the optimal bulk size? Elasticsearch

    Master Nodes (3) Ingest Nodes (X) Data Nodes Hot (X) Data Notes Warm (X) X-Pack __________ __________ __________ __________ __________ __________ __________ __________ __________ __________ __________ __________ __________ __________ __________ __________ __________ __________ __________ __________ __________ __________ __________ __________ __________ __________ __________ __________ __________ __________ __________ __________ __________ __________ __________ __________ __________ __________ __________ __________ _____ 1000
 log events Beats Logstash Application 4 * 250? 1 * 1000? 2 * 500?
  39. @dadoonet sli.do/elastic 84 It depends... • on your application (language,

    libraries, ...) • document size (100b, 1kb, 100kb, 1mb, ...) • number of nodes • node size • number of shards • shards distribution
  40. @dadoonet sli.do/elastic 85 Test it ;) Elasticsearch Master Nodes (3)

    Ingest Nodes (X) Data Nodes Hot (X) Data Notes Warm (X) X-Pack __________ __________ __________ __________ __________ __________ __________ __________ __________ __________ __________ __________ __________ __________ __________ __________ __________ __________ __________ __________ __________ __________ __________ __________ __________ __________ __________ __________ __________ __________ __________ __________ __________ __________ __________ __________ __________ __________ __________ __________ _____ 1000000
 log events Beats Logstash Application 4000 * 250-> 160s 1000 * 1000-> 155s 2000 * 500-> 164s
  41. @dadoonet sli.do/elastic 86 Test it ;) DATE=`date +%Y.%m.%d` LOG=logs/logs.txt exec_test

    () { curl -s -XDELETE "http://USER:PASS@HOST:9200/logstash-$DATE" sleep 10 export SIZE=$1 time cat $LOG | ./bin/logstash -f logstash.conf } for SIZE in 100 500 1000 3000 5000 10000; do for i in {1..20}; do exec_test $SIZE done; done; input { stdin{} } filter {} output { elasticsearch { hosts => ["10.12.145.189"] flush_size => "${SIZE}" } } In Beats set "bulk_max_size" in the output.elasticsearch
  42. @dadoonet sli.do/elastic 87 Test it ;) • 2 node cluster

    (m3.large) ‒ 2 vCPU, 7.5GB Memory, 1x32GB SSD • 1 index server (m3.large) ‒ logstash ‒ kibana # docs 100 500 1000 3000 5000 10000 time(s) 191.7 161.9 163.5 160.7 160.7 161.5
  43. @dadoonet sli.do/elastic 89 Avoid Bottlenecks Elasticsearch X-Pack _________ _________ _________

    _________ _________ _________ _________ _________ _________ _________ _________ _________ _________ _________ _________ _________ _________ _________ _________ _________ _________ _________ _________ _________ _________ _________ _________ _________ _________ _________ _________ _________ _________ _________ _________ 1000000
 log events Beats Logstash Application single node Node 1 Node 2 round robin
  44. @dadoonet sli.do/elastic 90 Clients • Most clients implement round robin

    ‒ you specify a seed list ‒ the client sniffs the cluster ‒ the client implement different selectors • Logstash allows an array (no sniffing) • Beats allows an array (no sniffing) • Kibana only connects to one single node output { elasticsearch { hosts => ["node1","node2","node3"] } }
  45. @dadoonet sli.do/elastic 91 Load Balancer Elasticsearch X-Pack _________ _________ _________

    _________ _________ _________ _________ _________ _________ _________ _________ _________ _________ _________ _________ _________ _________ _________ _________ _________ _________ _________ _________ _________ _________ _________ _________ _________ _________ _________ _________ _________ _________ _________ _________ 1000000
 log events Beats Logstash Application LB Node 2 Node 1
  46. @dadoonet sli.do/elastic 92 Coordinating-only Node Elasticsearch X-Pack _________ _________ _________

    _________ _________ _________ _________ _________ _________ _________ _________ _________ _________ _________ _________ _________ _________ _________ _________ _________ _________ _________ _________ _________ _________ _________ _________ _________ _________ _________ _________ _________ _________ _________ _________ 1000000
 log events Beats Logstash Application Node 3
 co-node Node 2 Node 1
  47. @dadoonet sli.do/elastic 93 Test it ;) #docs time(s) 100 500

    1000 NO Round Robin 191.7 161.9 163.5 Round Robin 189.7 159.7 159.0 • 2 node cluster (m3.large) ‒ 2 vCPU, 7.5GB Memory, 1x32GB SSD • 1 index server (m3.large) ‒ logstash (round robin configured) ‒ hosts => ["10.12.145.189", "10.121.140.167"] ‒ kibana
  48. @dadoonet sli.do/elastic 95 Durability index a doc time lucene flush

    buffer index a doc buffer index a doc buffer buffer segment
  49. @dadoonet sli.do/elastic 96 refresh_interval • Dynamic per-index setting • Increase

    to get better write throughput to an index • New documents will take more time to be available for Search. PUT logstash-2017.05.16/_settings { "refresh_interval": "60s" } #docs time(s) 100 500 1000 1s refresh 189.7 159.7 159.0 60s refresh 185.8 152.1 152.6
  50. @dadoonet sli.do/elastic 97 Durability index a doc time lucene flush

    buffer segment trans_log buffer trans_log buffer trans_log elasticsearch flush doc op lucene commit segment segment
  51. @dadoonet sli.do/elastic 98 Translog fsync every 5s (1.7) index a

    doc buffer trans_log doc op index a doc buffer trans_log doc op Primary Replica redundancy doesn’t help if all nodes lose power
  52. @dadoonet sli.do/elastic 99 Translog fsync on every request • For

    low volume indexing, fsync matters less • For high volume indexing, we can amortize the costs and fsync on every bulk • Concurrent requests can share an fsync bulk 1 bulk 2 single fsync
  53. @dadoonet sli.do/elastic 100 Async Transaction Log • index.translog.durability ‒ request

    (default) ‒ async • index.translog.sync_interval (only if async is set) • Dynamic per-index settings • Be careful, you are relaxing the safety guarantees #docs time(s) 100 500 1000 Request fsync 185.8 152.1 152.6 5s sync 154.8 143.2 143.1
  54. @dadoonet sli.do/elastic 102 Final Remarks Beats Log Files Metrics Wire

    Data your{beat} Data Store Web APIs Social Sensors Elasticsearch Master Nodes (3) Ingest Nodes (X) Data Nodes Hot (X) Data Notes Warm (X) Logstash Nodes (X) Kafka Redis Messaging Queue Kibana Instances (X) Notification Queues Storage Metrics X-Pack X-Pack X-Pack
  55. @dadoonet sli.do/elastic 103 Final Remarks • Primaries ‒ More data

    -> More shards ‒ Do not overshard! • Replicas ‒ high availability (1 replica is the default) ‒ read throughput (More reads -> More replicas) Big Data ... ... ... ... ... ... U s e r s
  56. @dadoonet sli.do/elastic 104 Final Remarks • Bulk and Test •

    Distribute the Load • Refresh Interval • Async Trans Log (careful) #docs 100 500 1000 Default 191.7s 161.9s 163.5s RR+60s+Async5s 154.8s 143.2s 143.1s