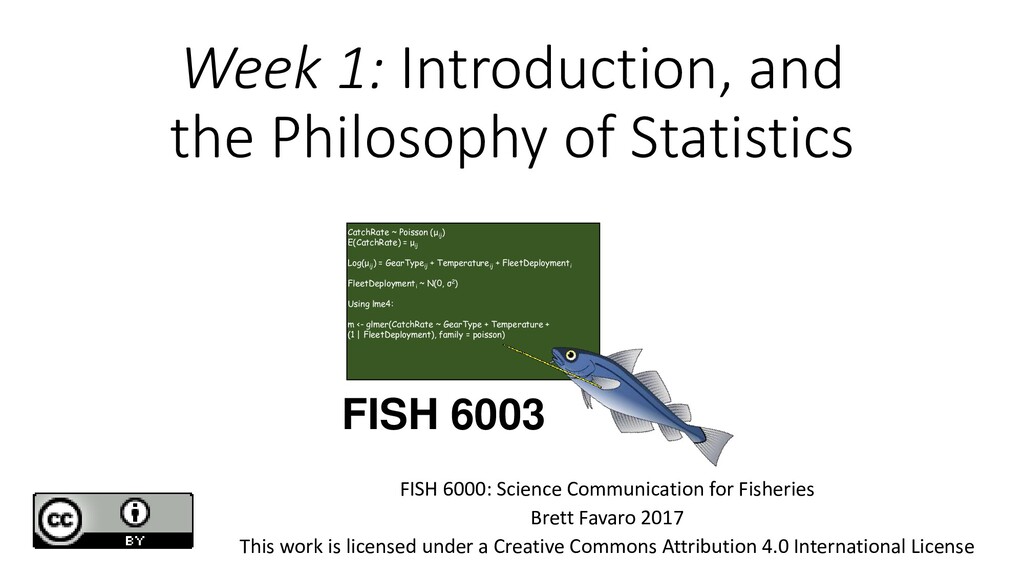
Poisson (μ ij ) E(CatchRate) = μ ij Log(μ ij ) = GearType ij + Temperature ij + FleetDeployment i FleetDeployment i ~ N(0, σ2) Using lme4: m <- glmer(CatchRate ~ GearType + Temperature + (1 | FleetDeployment), family = poisson) FISH 6003 FISH 6000: Science Communication for Fisheries Brett Favaro 2017 This work is licensed under a Creative Commons Attribution 4.0 International License
in which we gather as the ancestral homelands of the Beothuk, and the island of Newfoundland as the ancestral homelands of the Mi’kmaq and Beothuk. We would also like to recognize the Inuit of Nunatsiavut and NunatuKavut and the Innu of Nitassinan, and their ancestors, as the original people of Labrador. We strive for respectful partnerships with all the peoples of this province as we search for collective healing and true reconciliation and honour this beautiful land together. http://www.mun.ca/aboriginal_affairs/
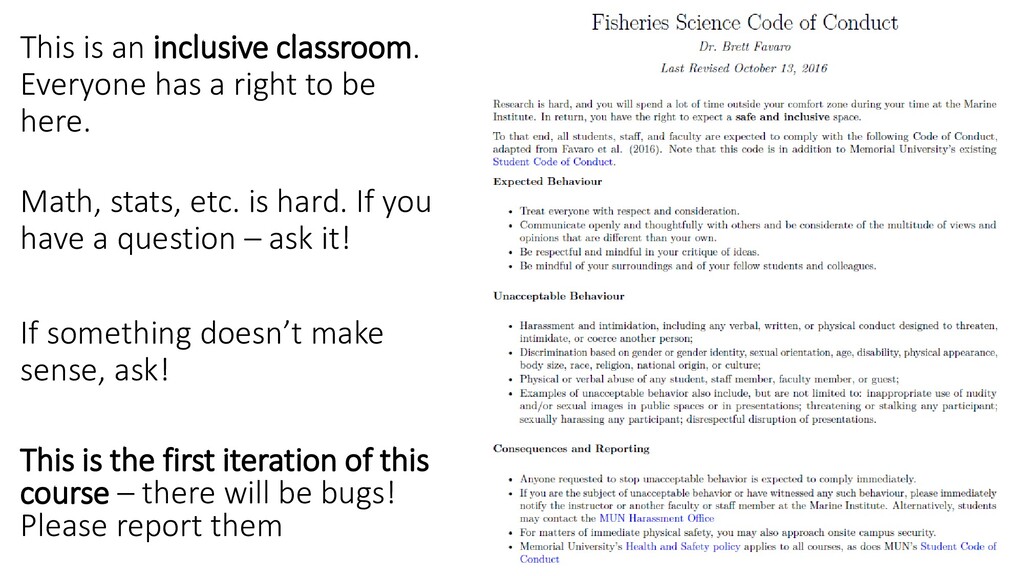
be here. Math, stats, etc. is hard. If you have a question – ask it! If something doesn’t make sense, ask! This is the first iteration of this course – there will be bugs! Please report them
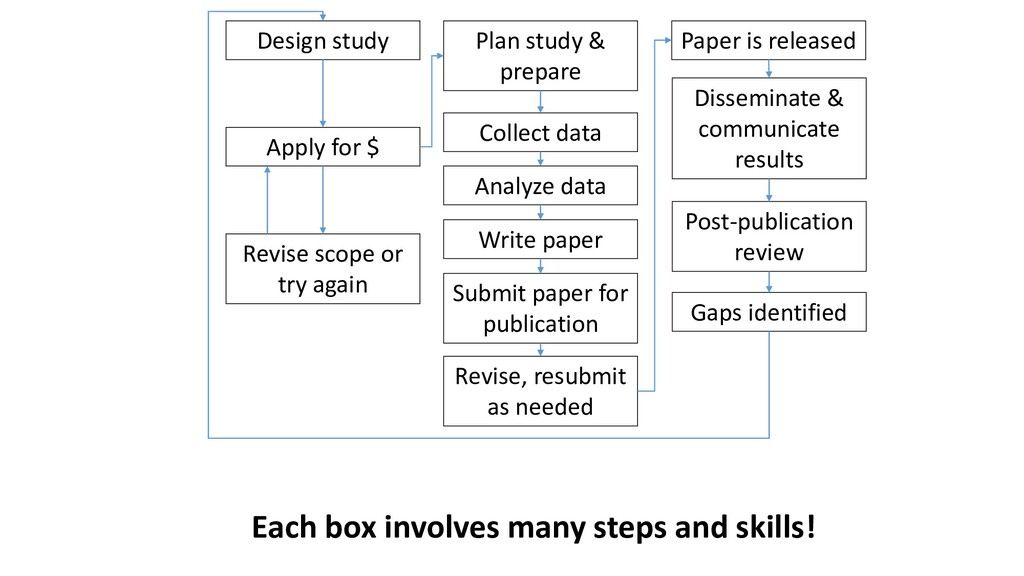
for $ Plan study & prepare Collect data Analyze data Write paper Submit paper for publication Revise, resubmit as needed Revise scope or try again Paper is released Post-publication review Disseminate & communicate results Gaps identified
Collect data Analyze data Write paper Submit paper for publication Revise, resubmit as needed Revise scope or try again Paper is released Post-publication review Disseminate & communicate results Gaps identified Steps in blue are mostly communication (FISH 6000) Steps in red are mostly data skills (FISH 6002) Steps in green are largely statistics (FISH 6003) Steps in gold depend on breadth of knowledge (FISH 6001)
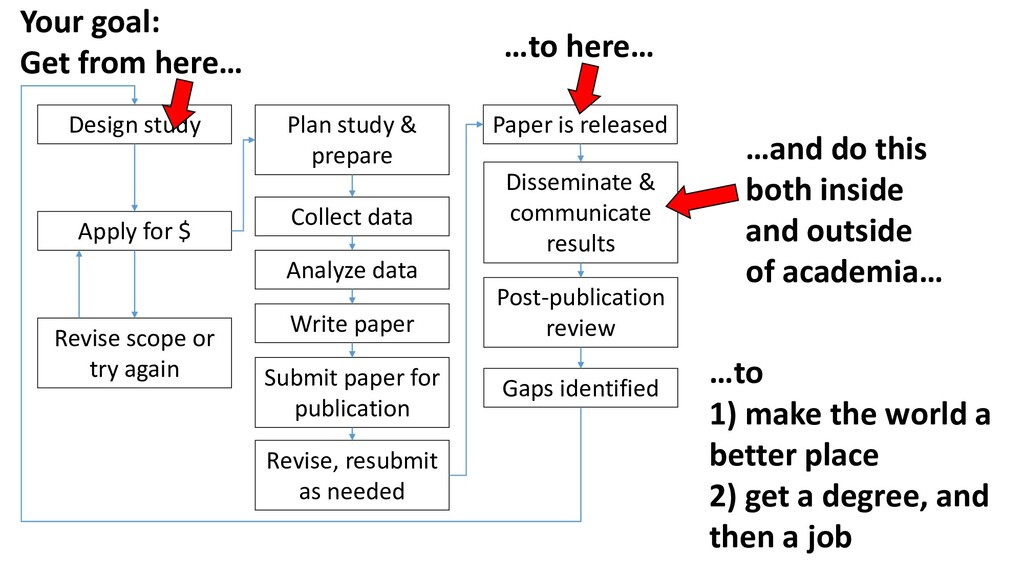
data Analyze data Write paper Submit paper for publication Revise, resubmit as needed Revise scope or try again Paper is released Post-publication review Disseminate & communicate results Gaps identified Your goal: Get from here… …to here… …and do this both inside and outside of academia… …to 1) make the world a better place 2) get a degree, and then a job
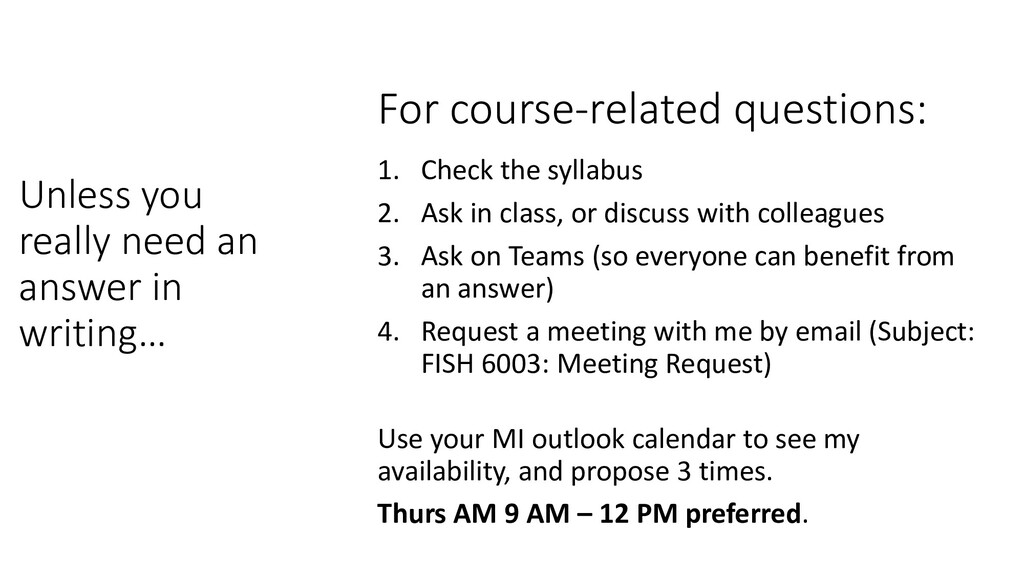
questions: 1. Check the syllabus 2. Ask in class, or discuss with colleagues 3. Ask on Teams (so everyone can benefit from an answer) 4. Request a meeting with me by email (Subject: FISH 6003: Meeting Request) Use your MI outlook calendar to see my availability, and propose 3 times. Thurs AM 9 AM – 12 PM preferred.
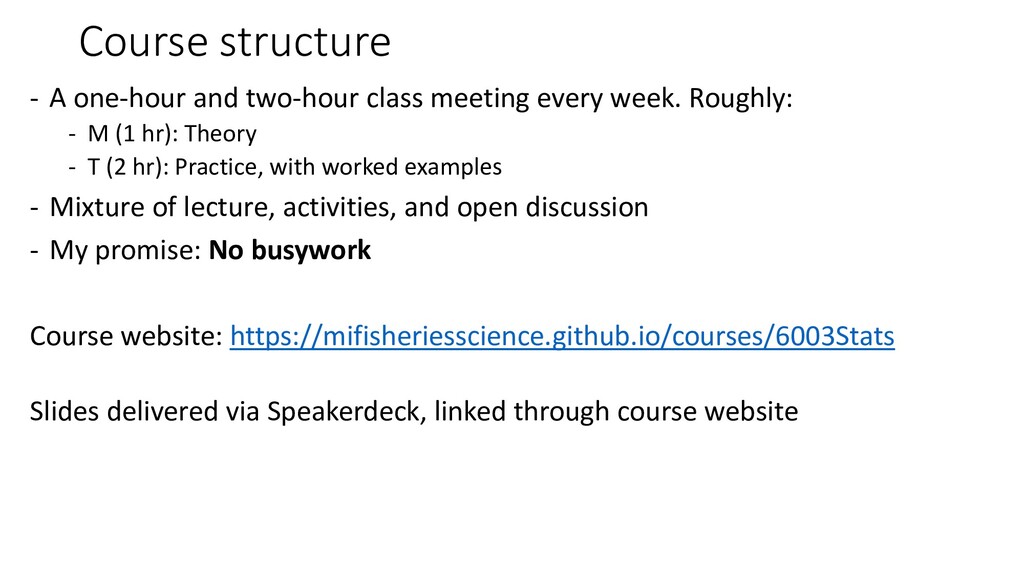
week. Roughly: - M (1 hr): Theory - T (2 hr): Practice, with worked examples - Mixture of lecture, activities, and open discussion - My promise: No busywork Course website: https://mifisheriesscience.github.io/courses/6003Stats Slides delivered via Speakerdeck, linked through course website
the life sciences • Ecology, fisheries, etc. are harder than many other fields because the natural world is complex • Ecology literature is rife with statistical error. Much of it doesn’t matter. Some of it does. We want to be reproducible so errors can be caught early. • You cannot design studies properly without knowing how the data will be analyzed. Studies may be underpowered, etc. And finally… • Ecological systems violate many assumptions of common statistical models. So our stats are hard!
biologist with statistical training • Alain Zuur and Elena Ieno’s Highland Statistics courses • Dolph Schluter BIOL 501 (UBC) • Stats Beerz / Stats Therapy • But mostly: Reading lots! • This is the third offering of FISH 6003. There will be errors. Please point them out to me! Let’s learn together
be application-focused. Goal is to learn enough to know when and how to use various statistical techniques common in experimental ecological • We will spend the vast majority of our time on regression-type analyses (i.e. evaluating association between X and Y) because it underpins most of experimental science • It is almost certain that during your degree you will need to go in more detail on each topic than we will have time to cover • Course will be broad, less deep than some. Logic; If you’re aware of a technique, even without fully ‘getting’ it, you will be able to self- teach. Focus on making good decisions, and documenting them
6002 is not a formal pre-requisite – 6002 goes further than is needed for 6003. And I like to be flexible. If you have not done 6002, I recommend reviewing: https://mifisheriesscience.github.io/courses/6002Data/ Essential: Weeks 1-5 Helpful: Weeks 7-9 You should be familiar with R basics. I also won’t spend much time covering data management, how to code variables, etc.
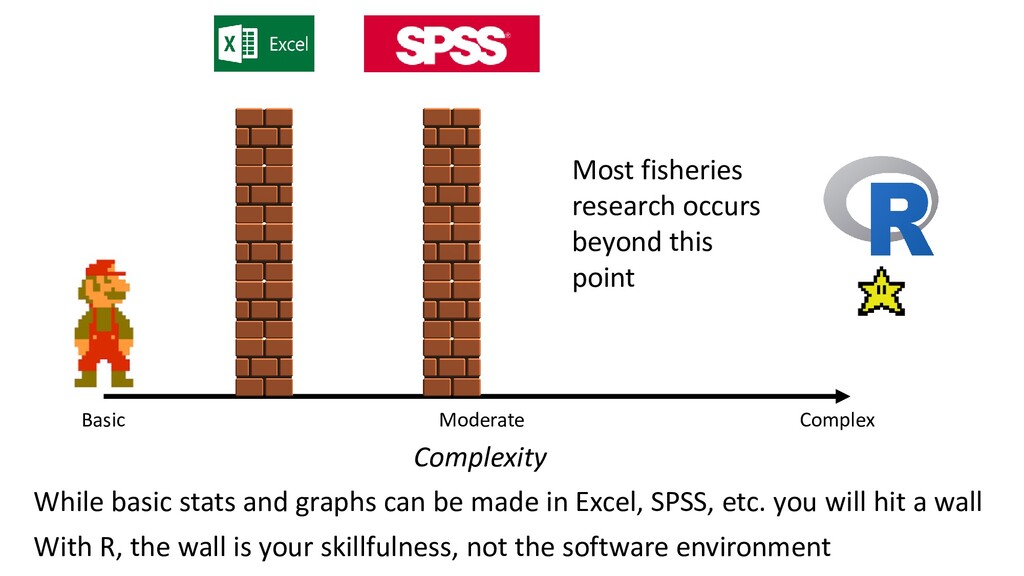
be made in Excel, SPSS, etc. you will hit a wall Most fisheries research occurs beyond this point With R, the wall is your skillfulness, not the software environment
It makes your code easier to read Advanced: It adds some advanced features (projects, R Markdown, and a few other things) https://www.rstudio.com/ RStudio extends the functionality of R, and makes it easier to use
one day to complete. Usually, there will be in-class time given. You will be given directions on these in class. Expect there to be three minor assignments, which together will be worth 30% of the course grade.
will conduct a statistical analysis based on data you obtain. This will be a regression-type analysis, which we will cover extensively within this course (i.e. what is the impact of X on Y?) These data may be something that you have collected yourself for your research, from a public database, or as attached by another publication. Essentially, the major assignment is to do all the basic groundwork that would need to be done to prepare an analysis for publication.
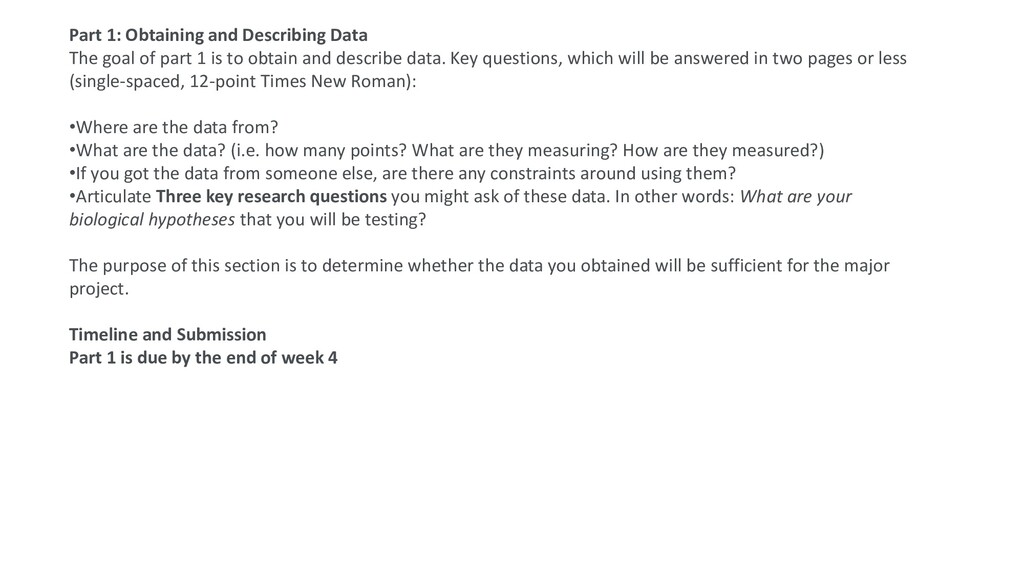
1 is to obtain and describe data. Key questions, which will be answered in two pages or less (single-spaced, 12-point Times New Roman): •Where are the data from? •What are the data? (i.e. how many points? What are they measuring? How are they measured?) •If you got the data from someone else, are there any constraints around using them? •Articulate Three key research questions you might ask of these data. In other words: What are your biological hypotheses that you will be testing? The purpose of this section is to determine whether the data you obtained will be sufficient for the major project. Timeline and Submission Part 1 is due by the end of week 4
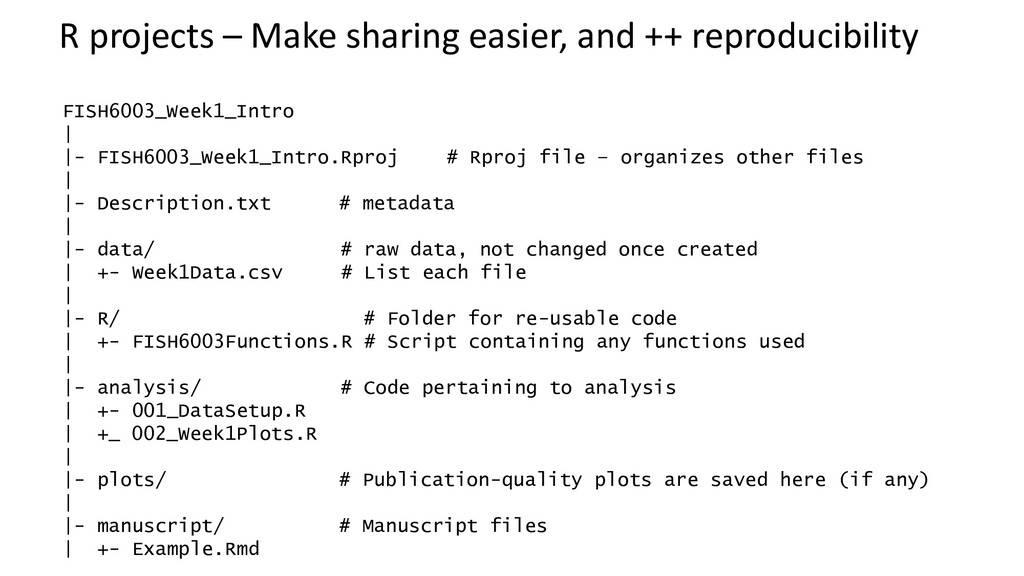
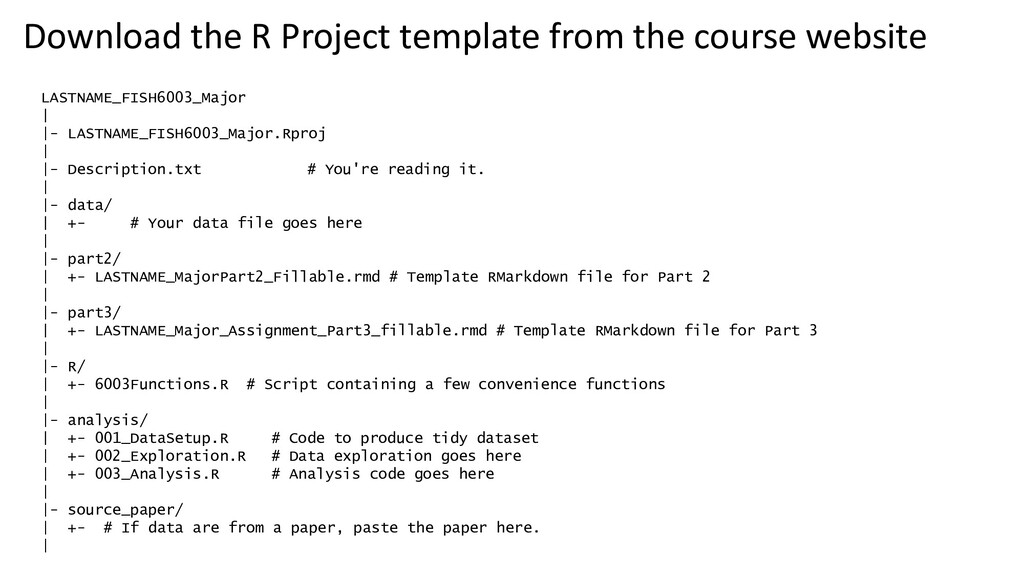
it. | |- data/ | +- # Your data file goes here | |- part2/ | +- LASTNAME_MajorPart2_Fillable.rmd # Template RMarkdown file for Part 2 | |- part3/ | +- LASTNAME_Major_Assignment_Part3_fillable.rmd # Template RMarkdown file for Part 3 | |- R/ | +- 6003Functions.R # Script containing a few convenience functions | |- analysis/ | +- 001_DataSetup.R # Code to produce tidy dataset | +- 002_Exploration.R # Data exploration goes here | +- 003_Analysis.R # Analysis code goes here | |- source_paper/ | +- # If data are from a paper, paste the paper here. | Download the R Project template from the course website
a data exploration, following a slightly modified version of the procedure explained in Zuur et al. 2009. You should report the results of each step. These steps include: A. State a biological hypothesis B. Visualize the experimental design, with a diagram C. Conducting the data exploration: 1. Outliers Y and X 2. Homogeneity Y 3. Normality Y 4. Zeroes Y 5. Collinearity X 6. Relationships Y and X 7. Interactions 8. Independence of Y This will all make sense later
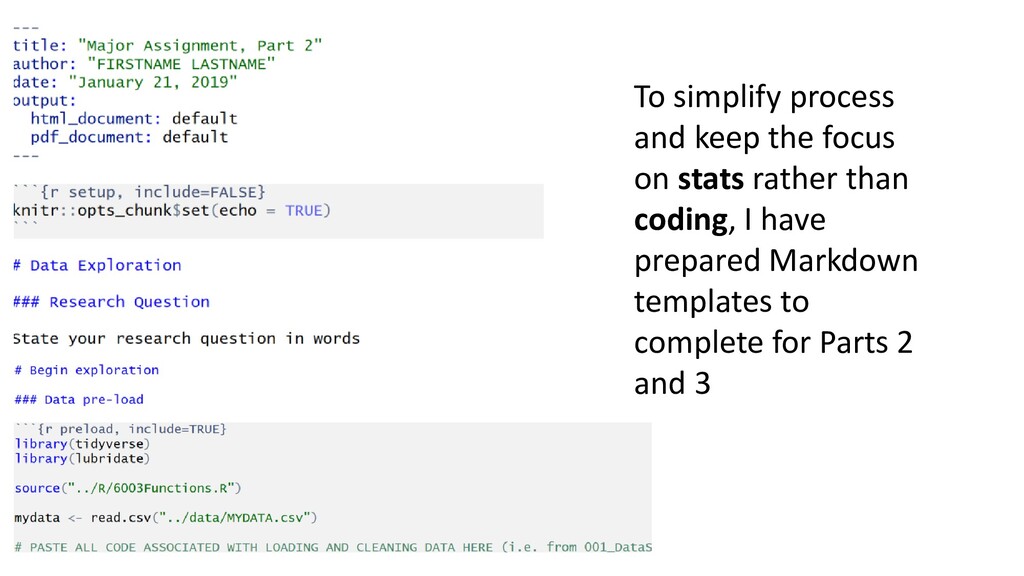
you will conduct a regression-type data analysis, following the reporting procedure explained in Zuur and Ieno, 2016. The steps to this assignment include: 1.Identify the dependency structure in the data 2.Present the statistical model 3.Fit the model 4.Validate the model 5.Interpret and present the numerical output of the model 6.Create a visual representation of the model 7.Simulate from the model Again, a Markdown template is provided