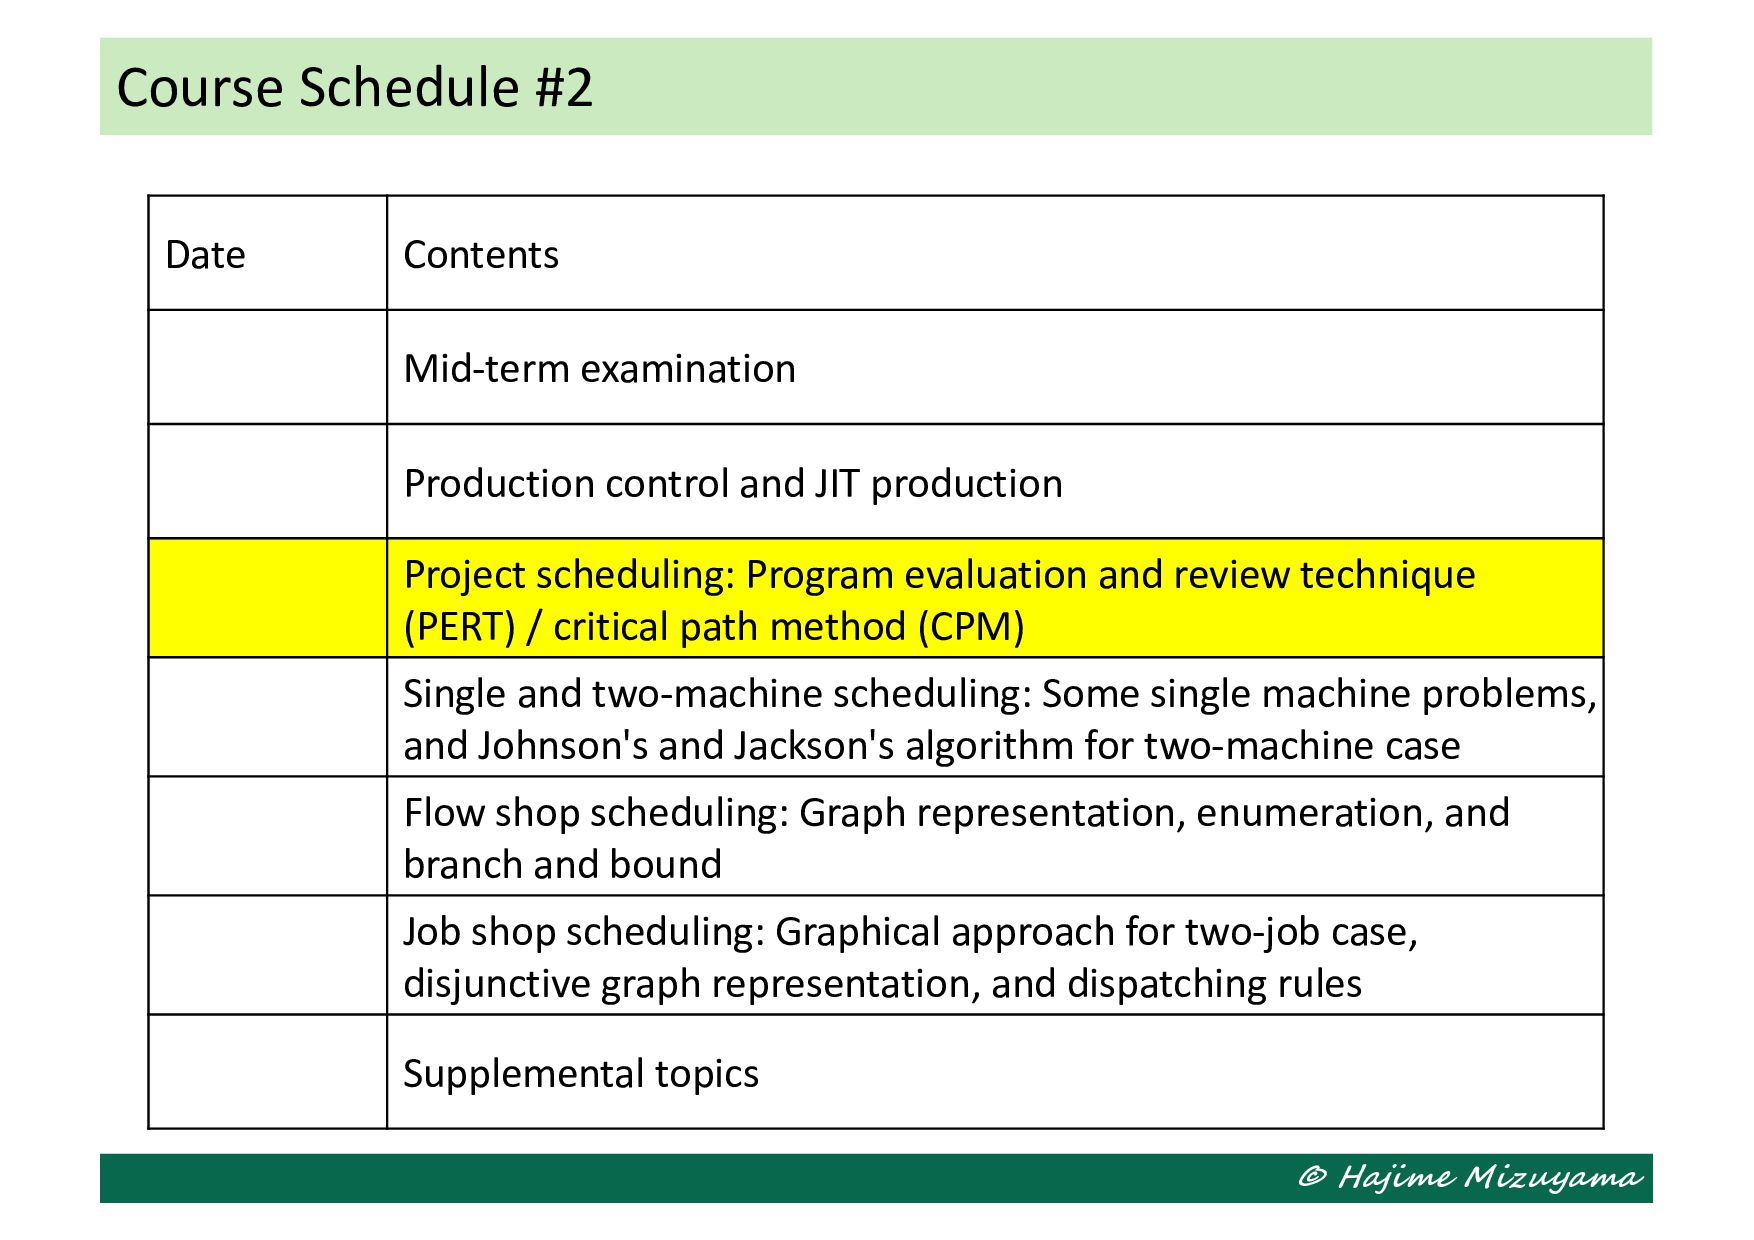
Production control and JIT production Project scheduling: Program evaluation and review technique (PERT) / critical path method (CPM) Single and two-machine scheduling: Some single machine problems, and Johnson's and Jackson's algorithm for two-machine case Flow shop scheduling: Graph representation, enumeration, and branch and bound Job shop scheduling: Graphical approach for two-job case, disjunctive graph representation, and dispatching rules Supplemental topics
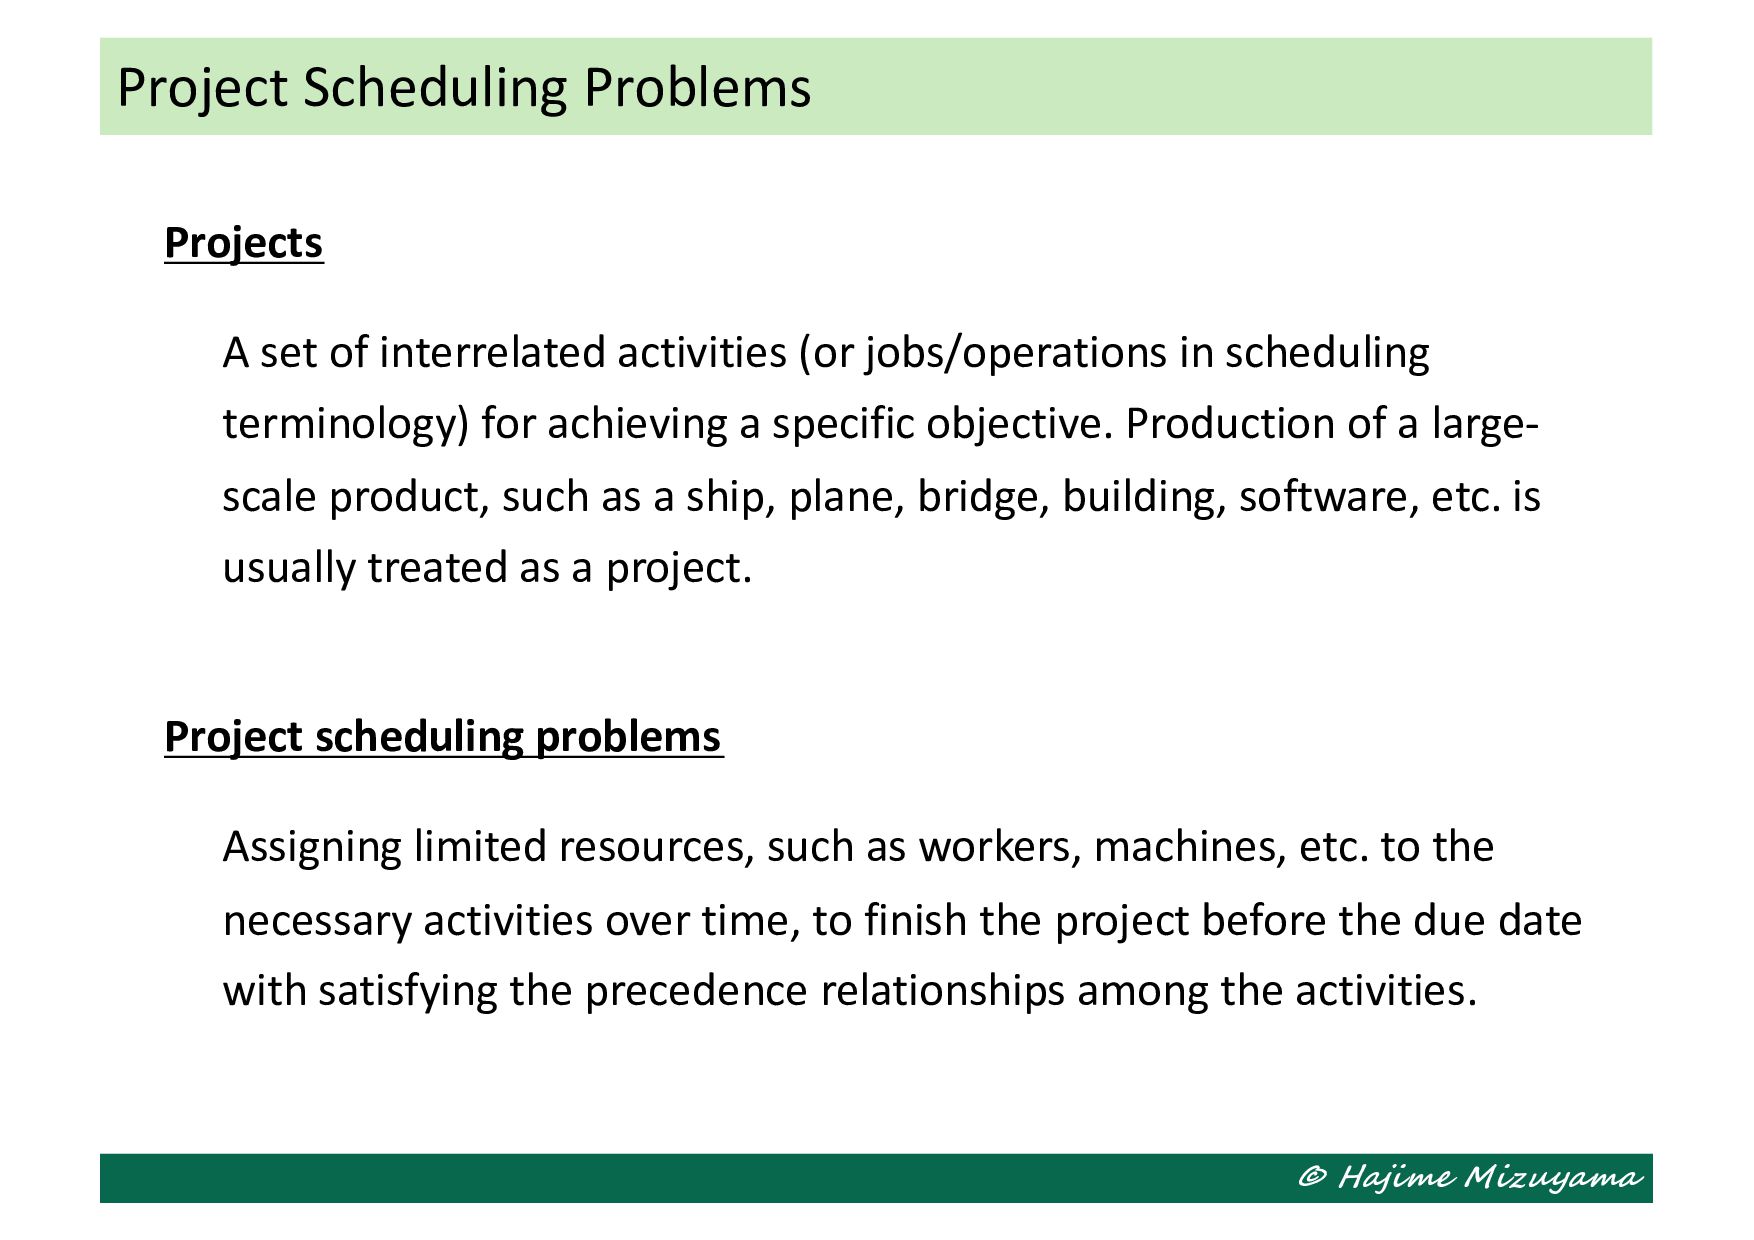
jobs/operations in scheduling terminology) for achieving a specific objective. Production of a large- scale product, such as a ship, plane, bridge, building, software, etc. is usually treated as a project. Project scheduling problems Assigning limited resources, such as workers, machines, etc. to the necessary activities over time, to finish the project before the due date with satisfying the precedence relationships among the activities. Project Scheduling Problems
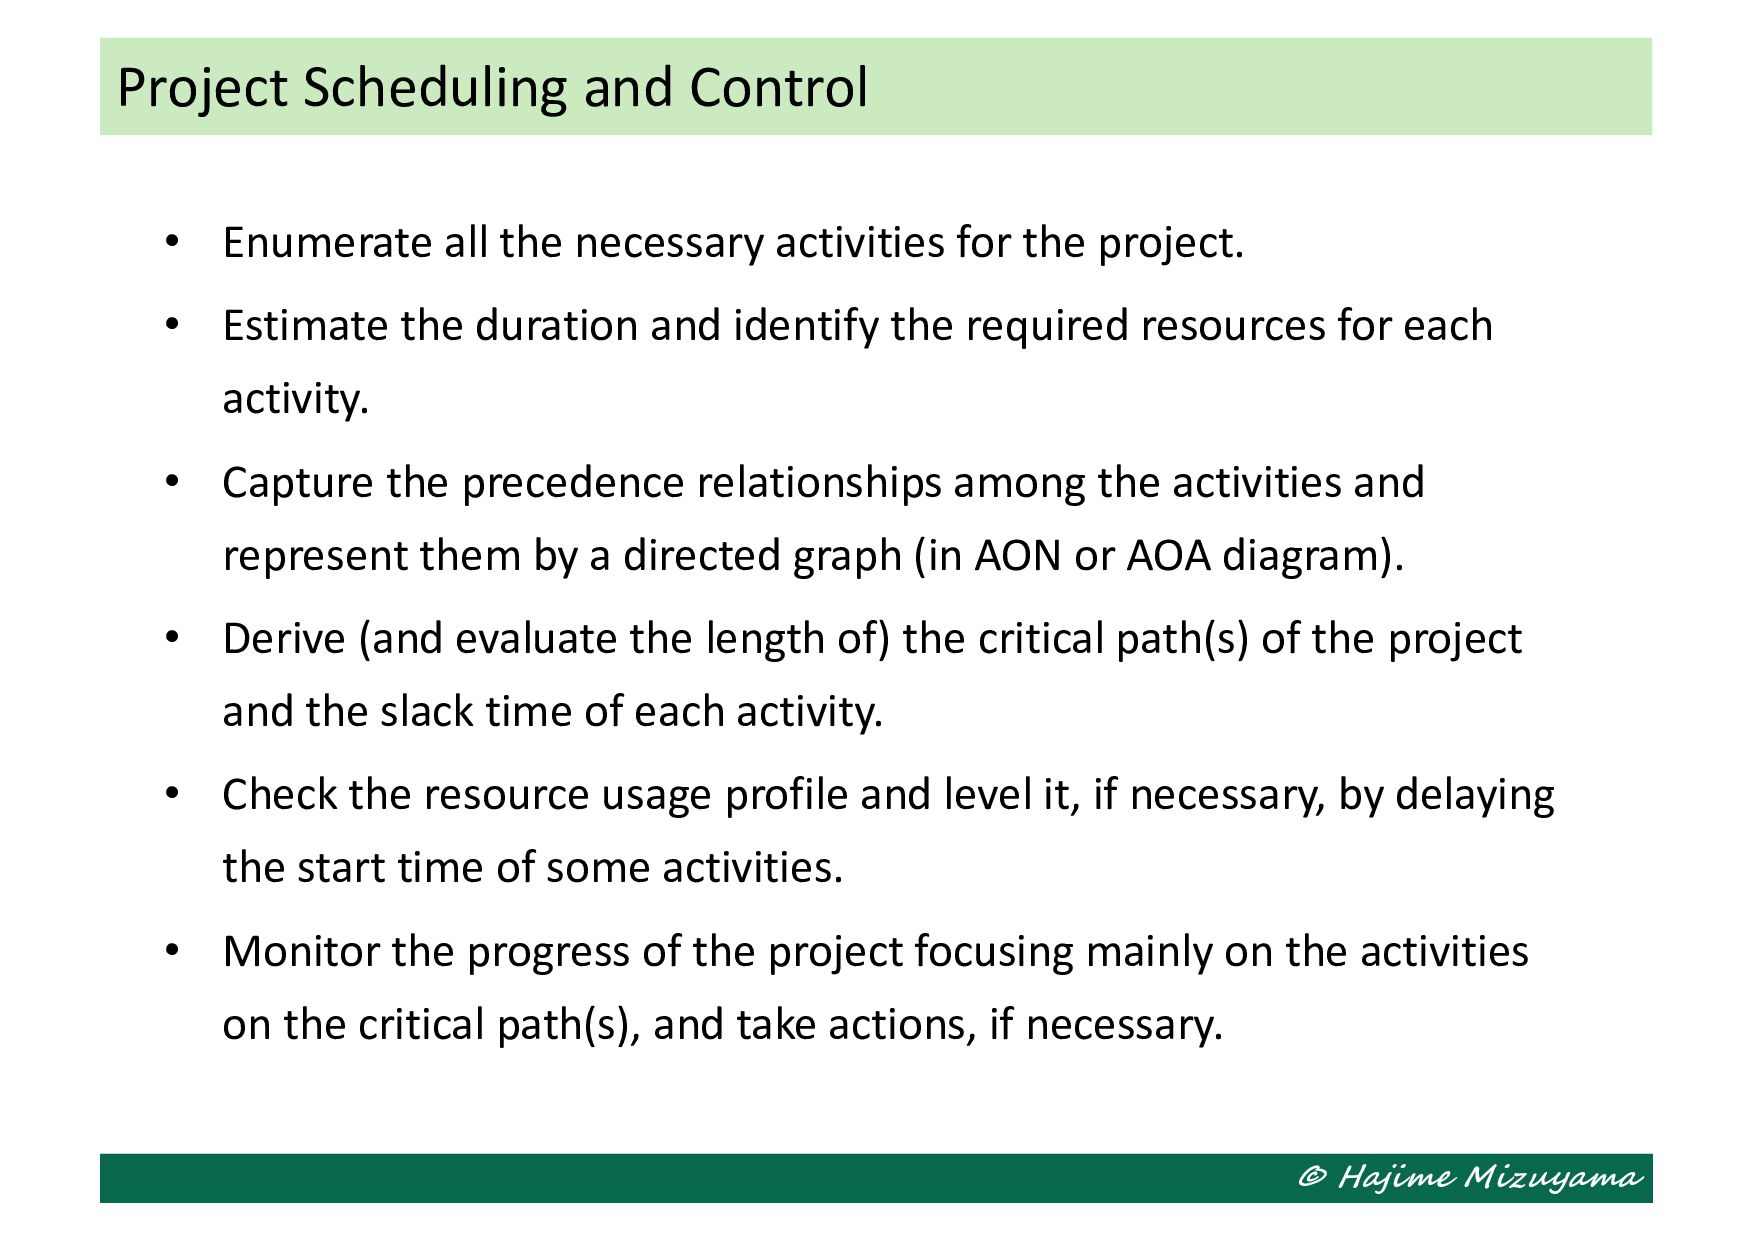
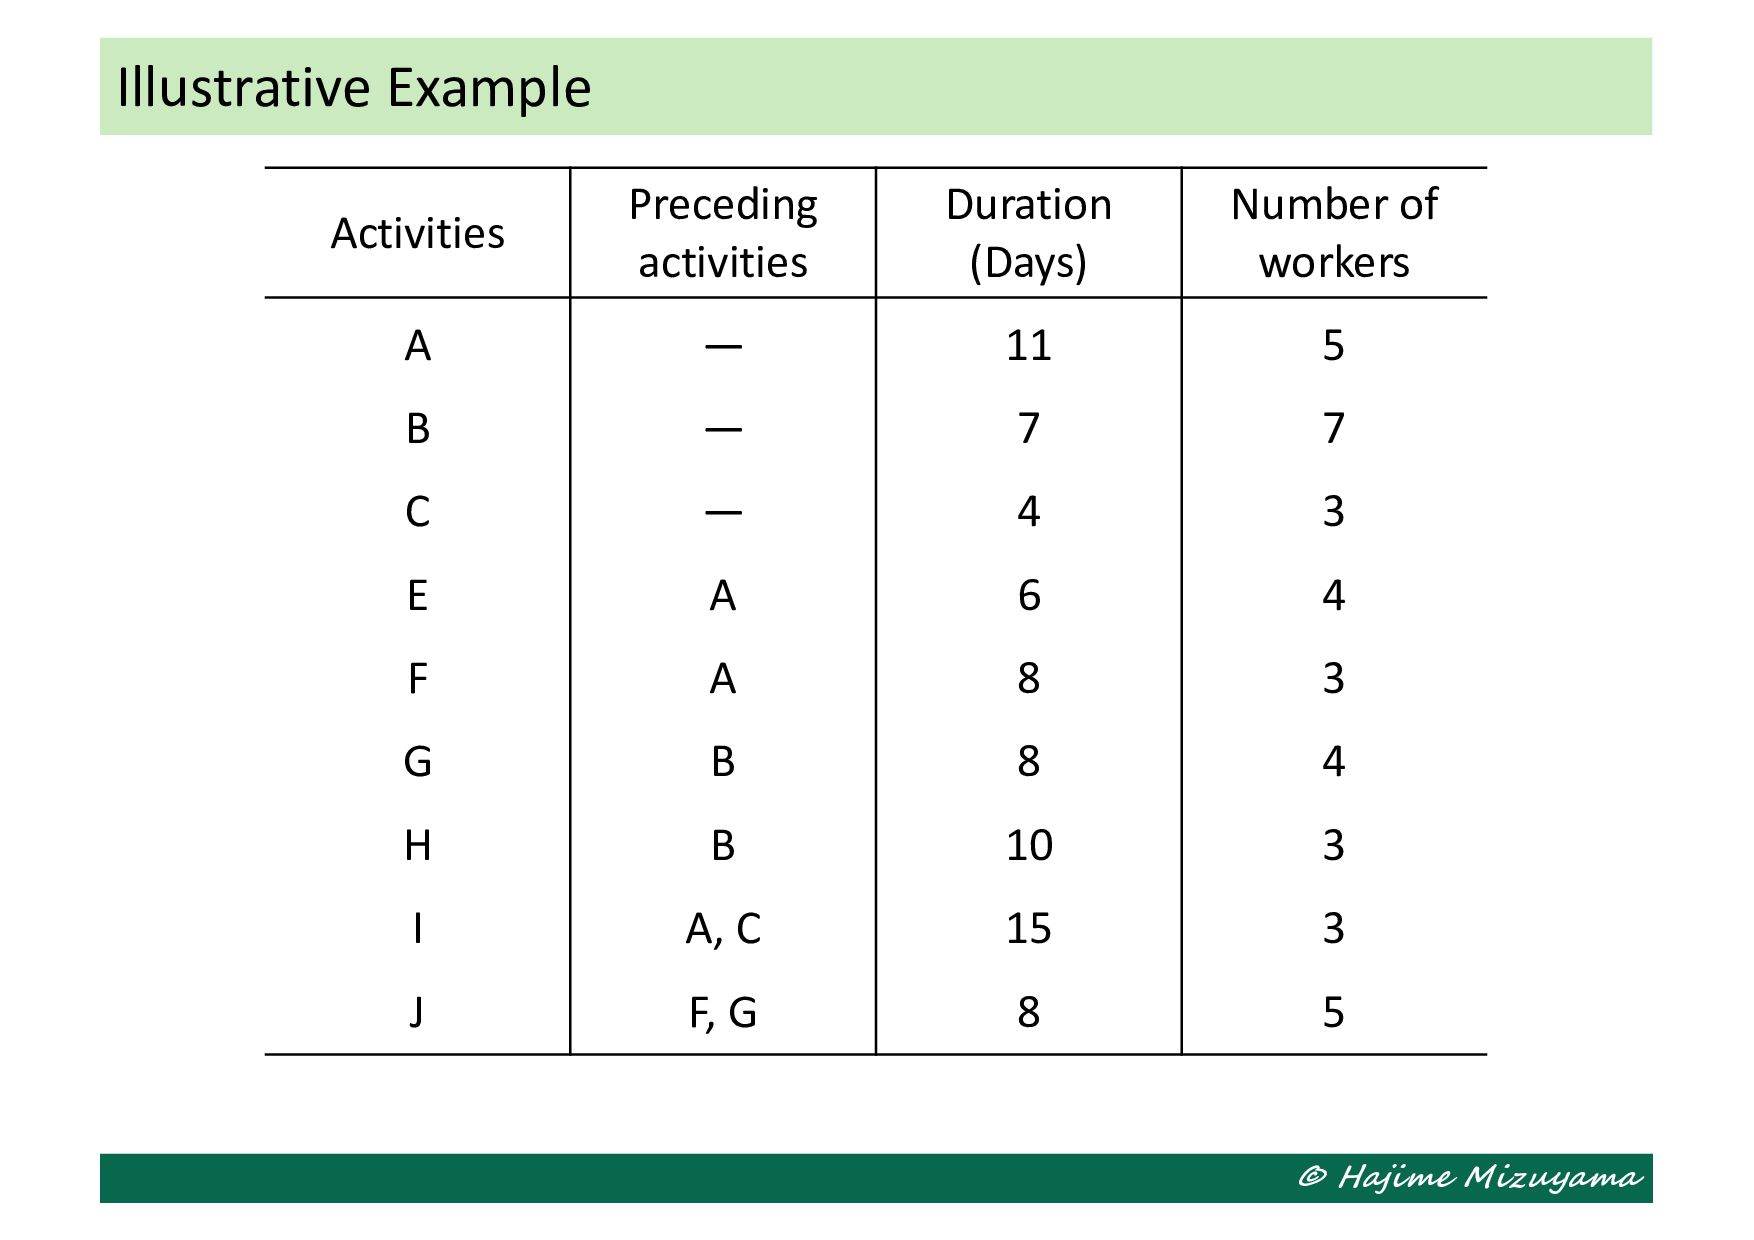
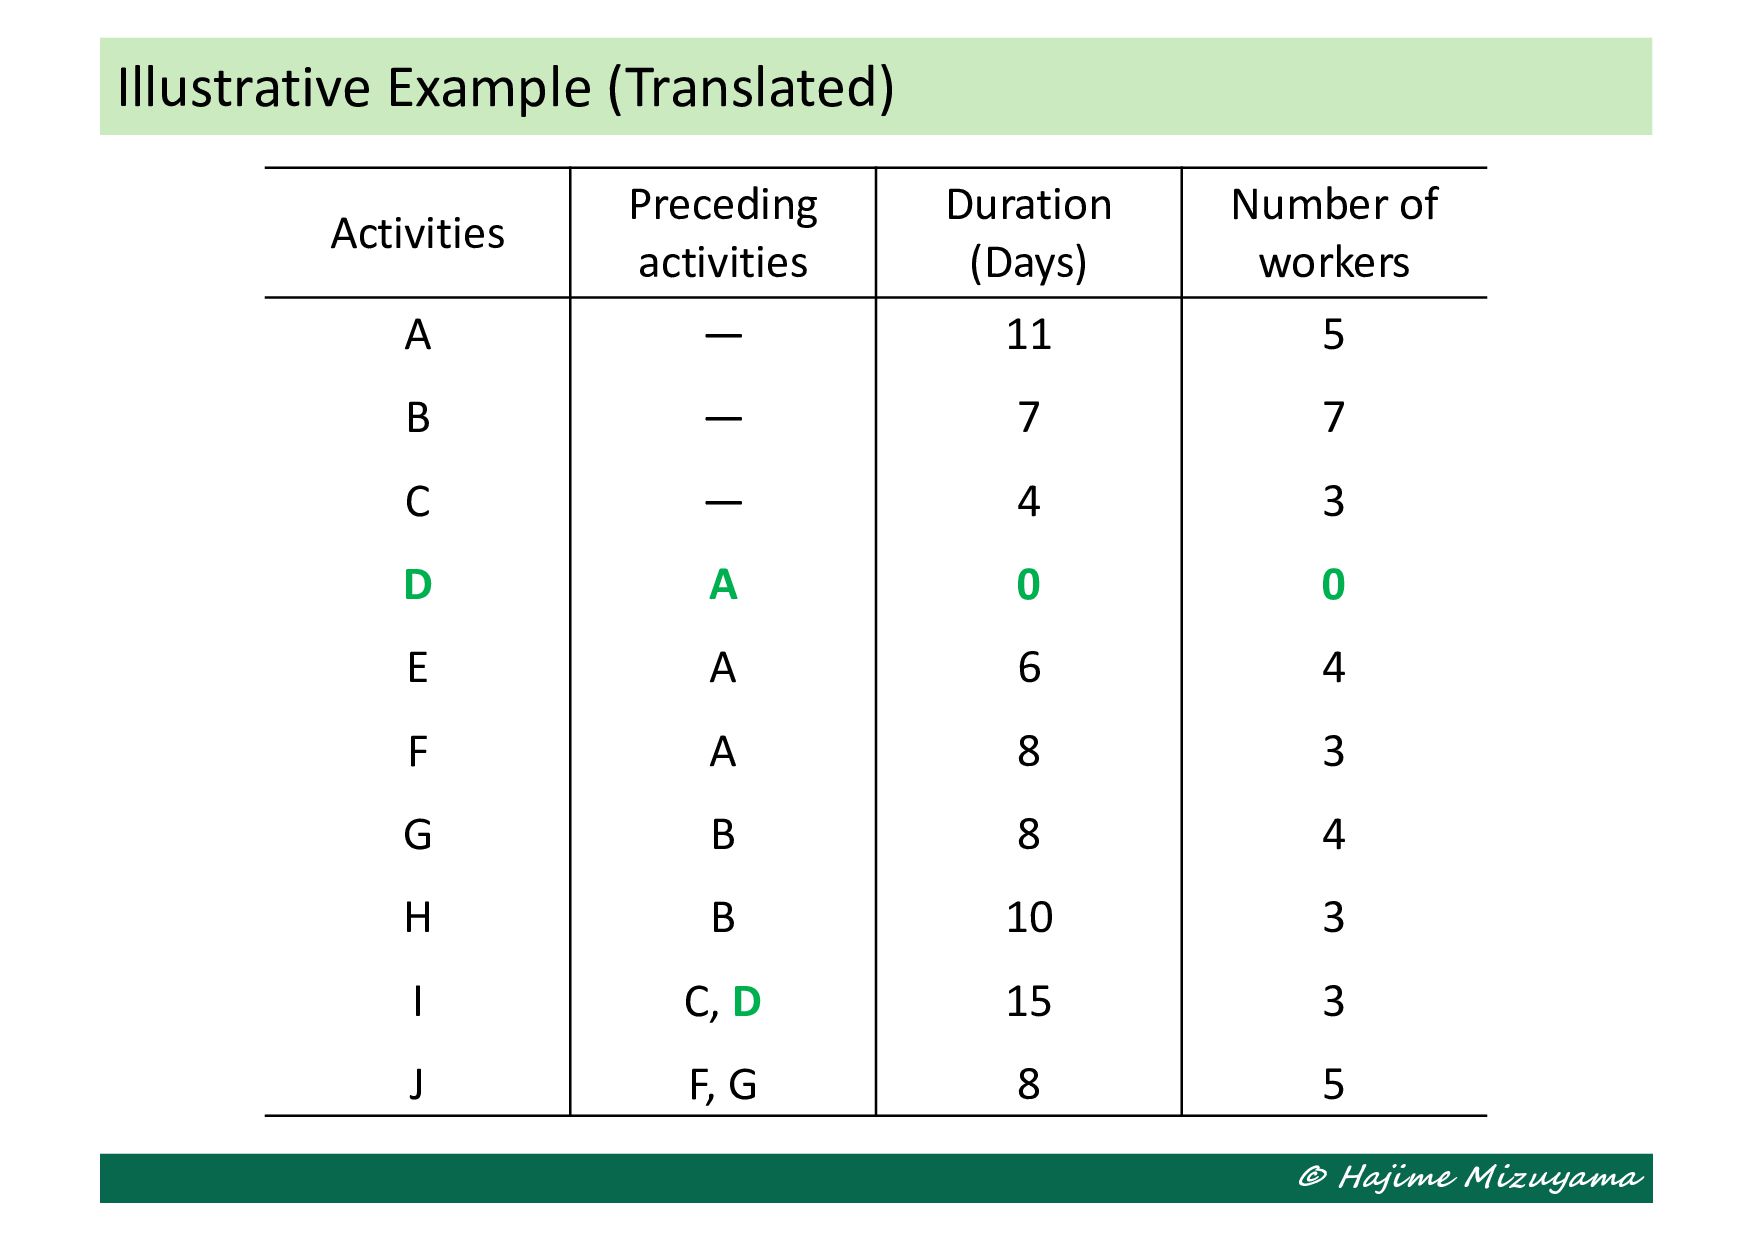
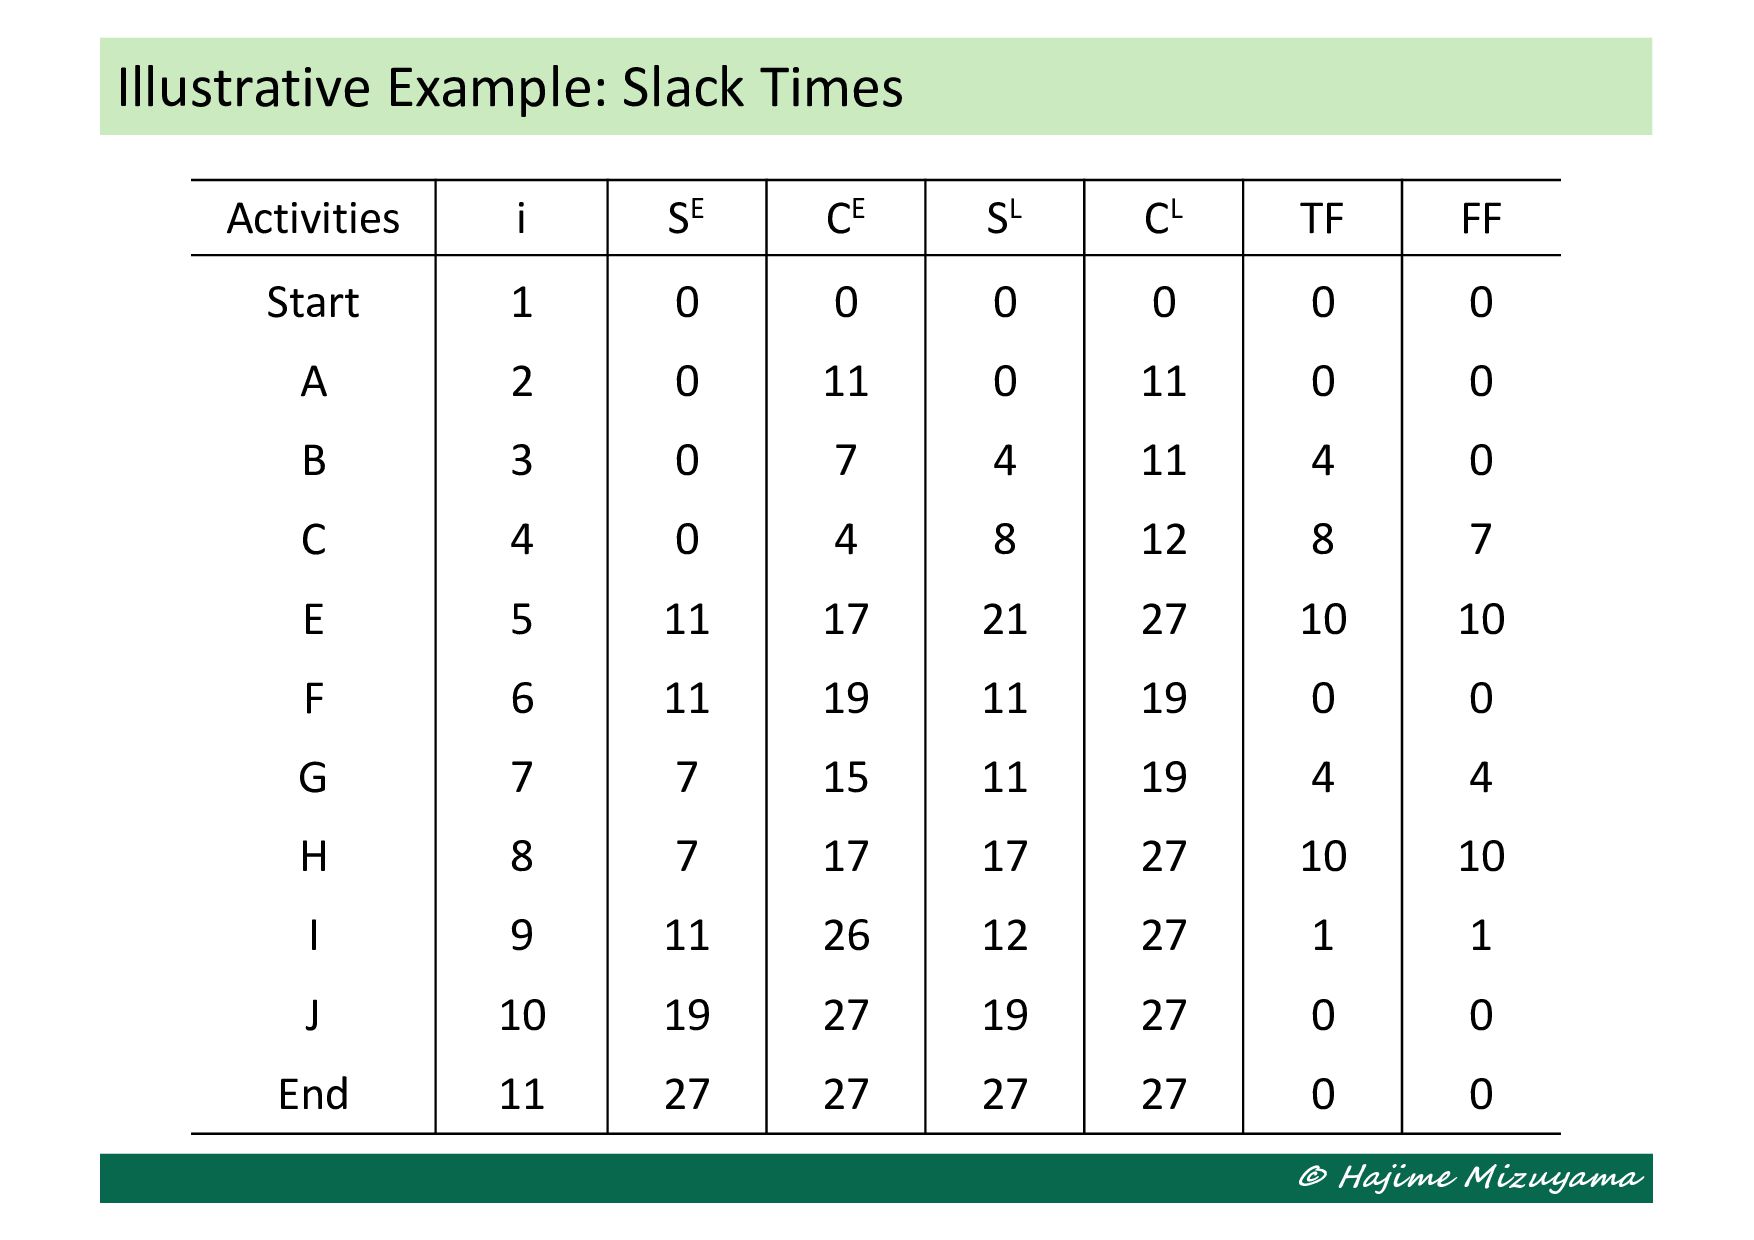
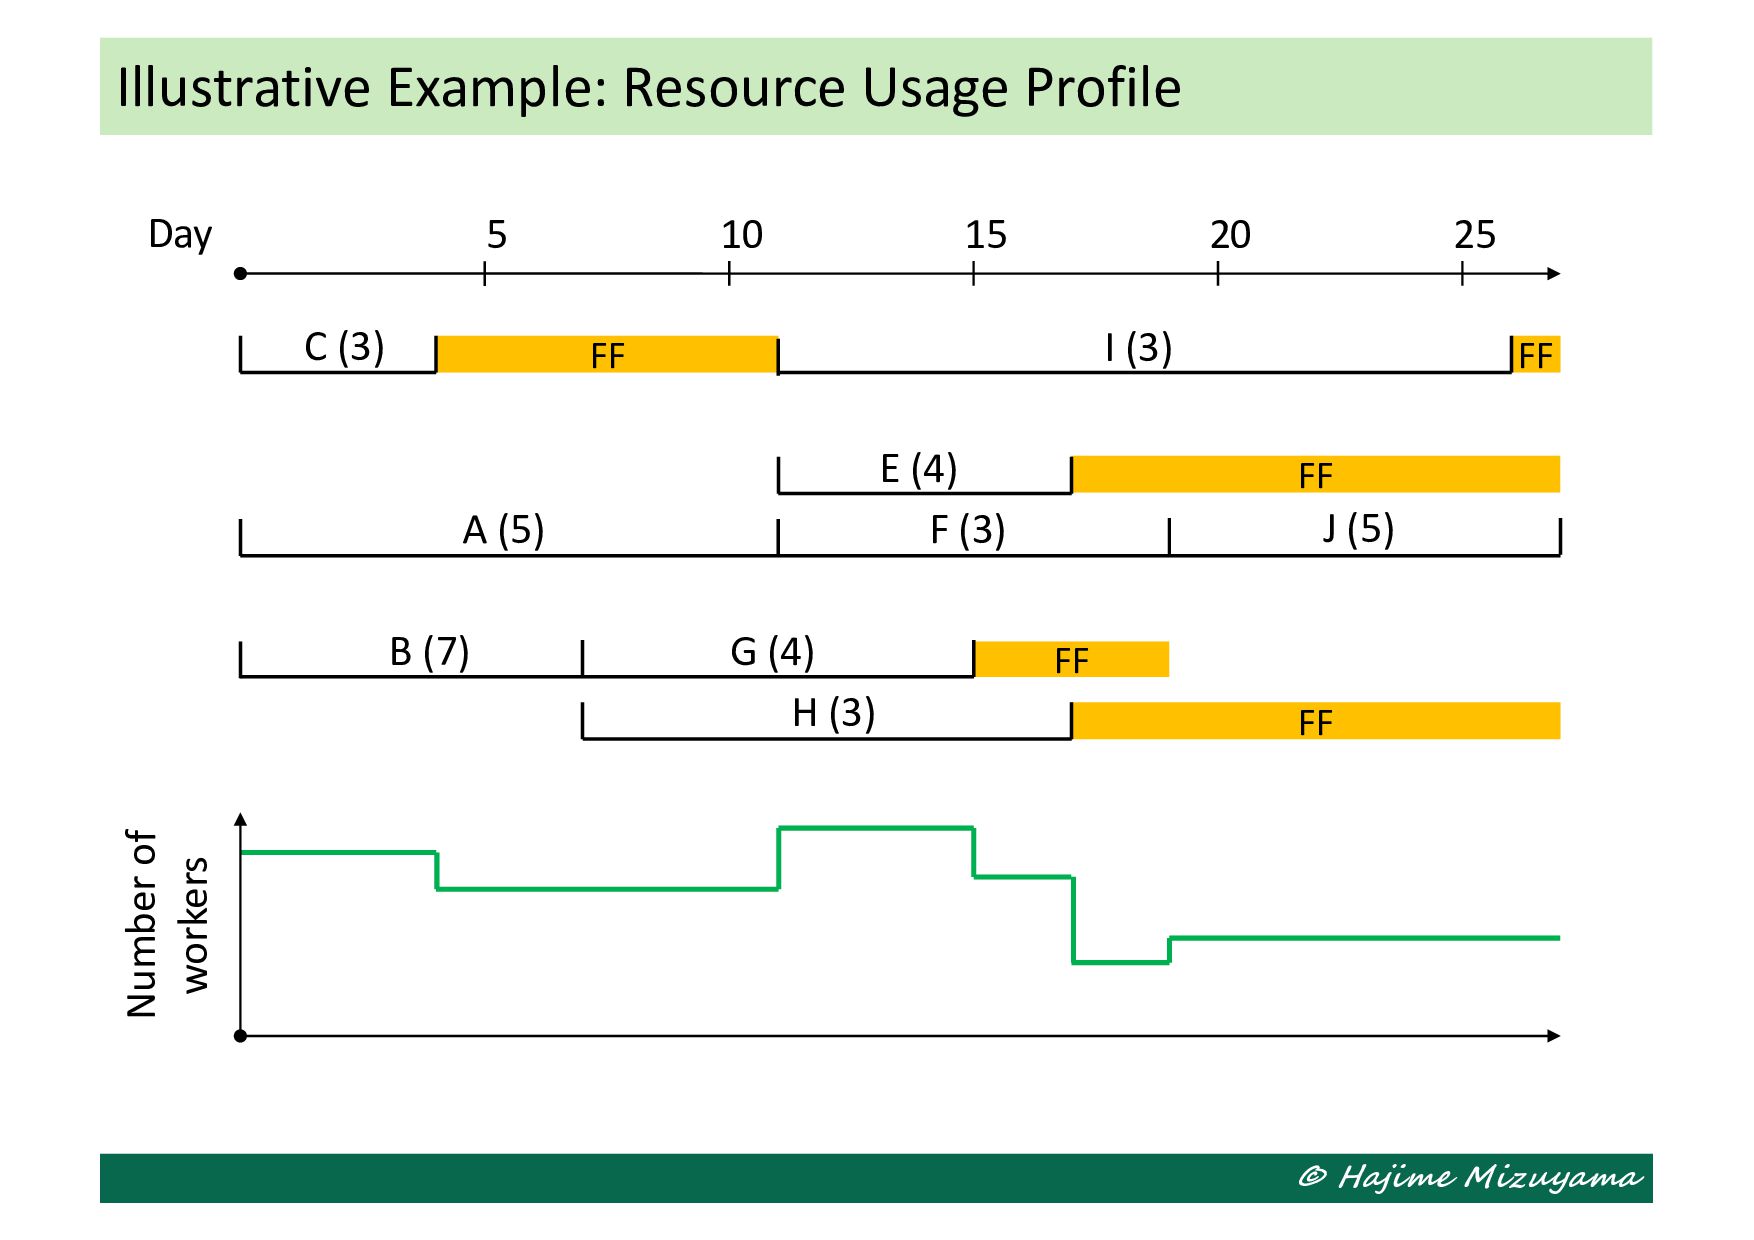
the project. • Estimate the duration and identify the required resources for each activity. • Capture the precedence relationships among the activities and represent them by a directed graph (in AON or AOA diagram). • Derive (and evaluate the length of) the critical path(s) of the project and the slack time of each activity. • Check the resource usage profile and level it, if necessary, by delaying the start time of some activities. • Monitor the progress of the project focusing mainly on the activities on the critical path(s), and take actions, if necessary. Project Scheduling and Control
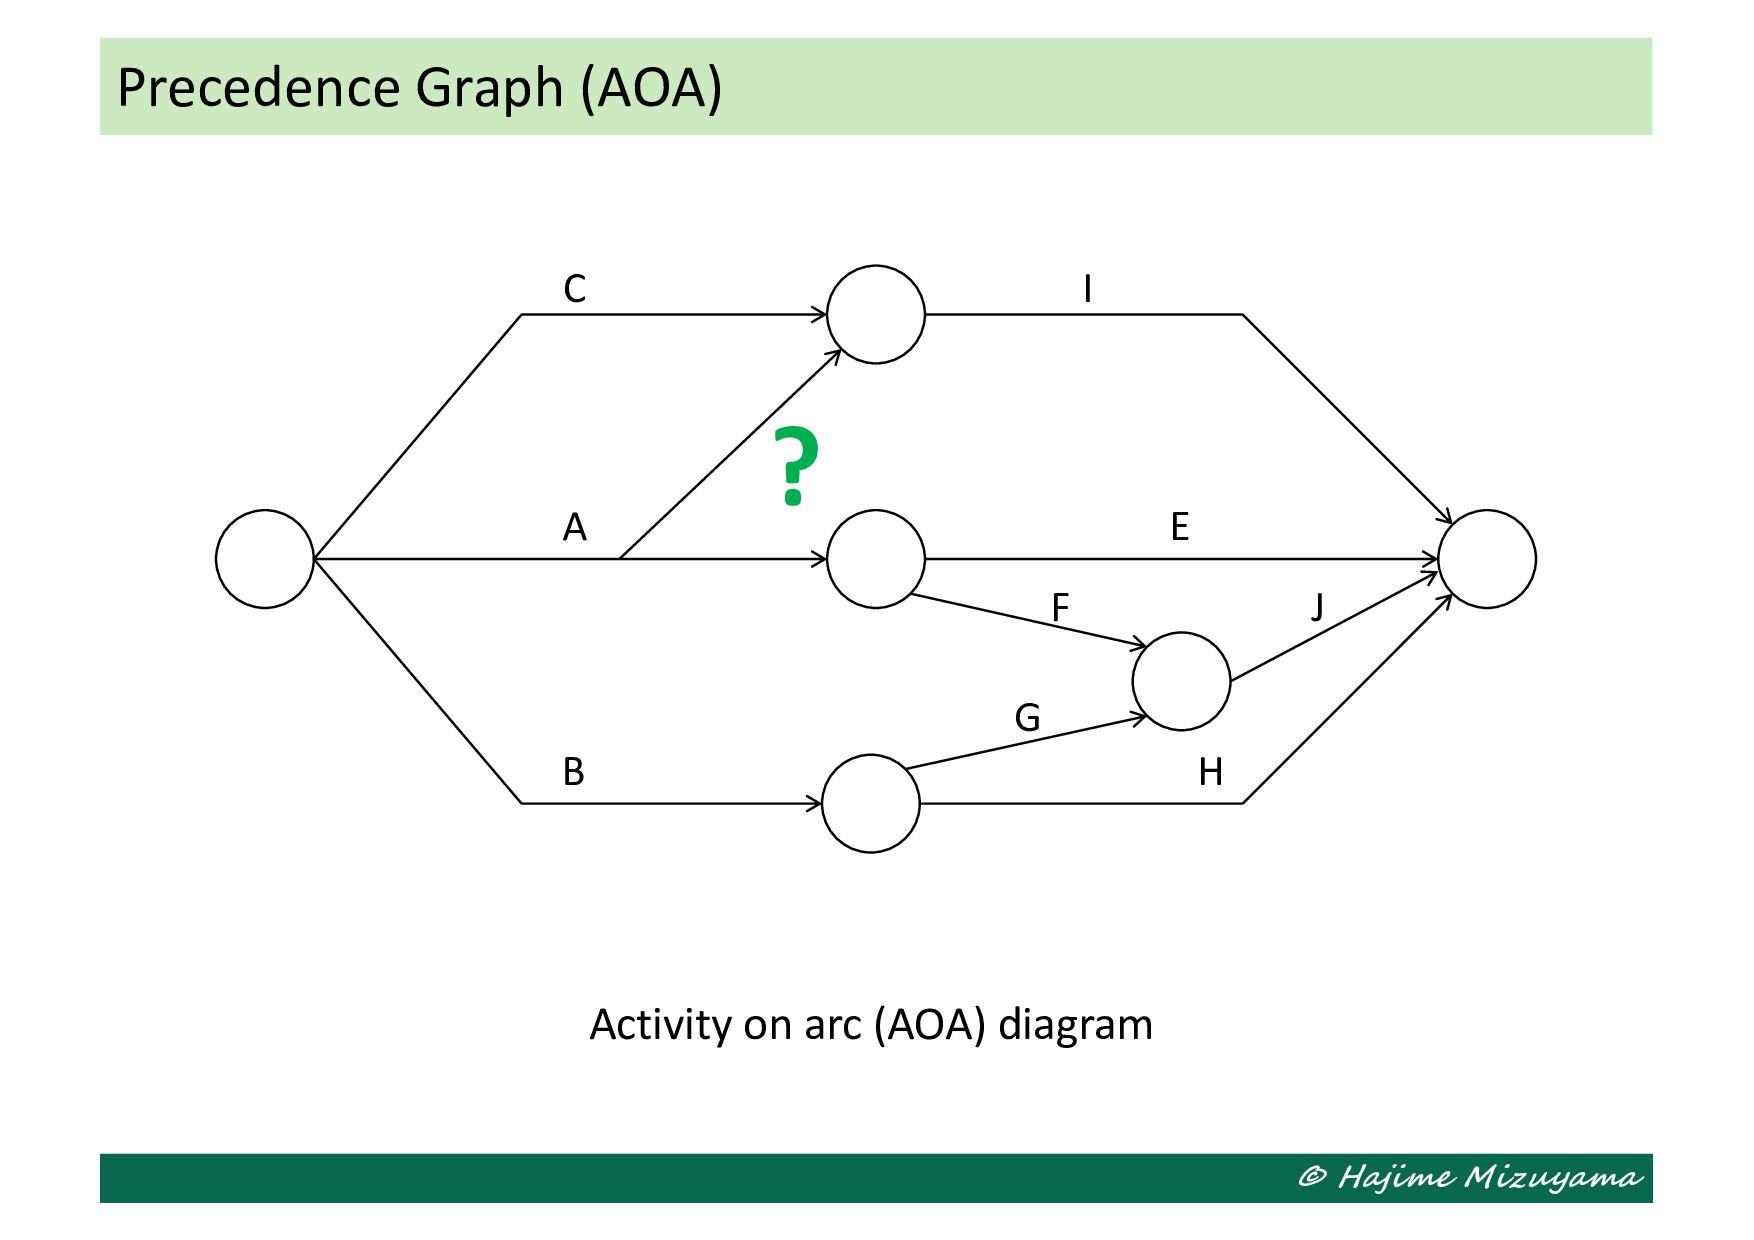
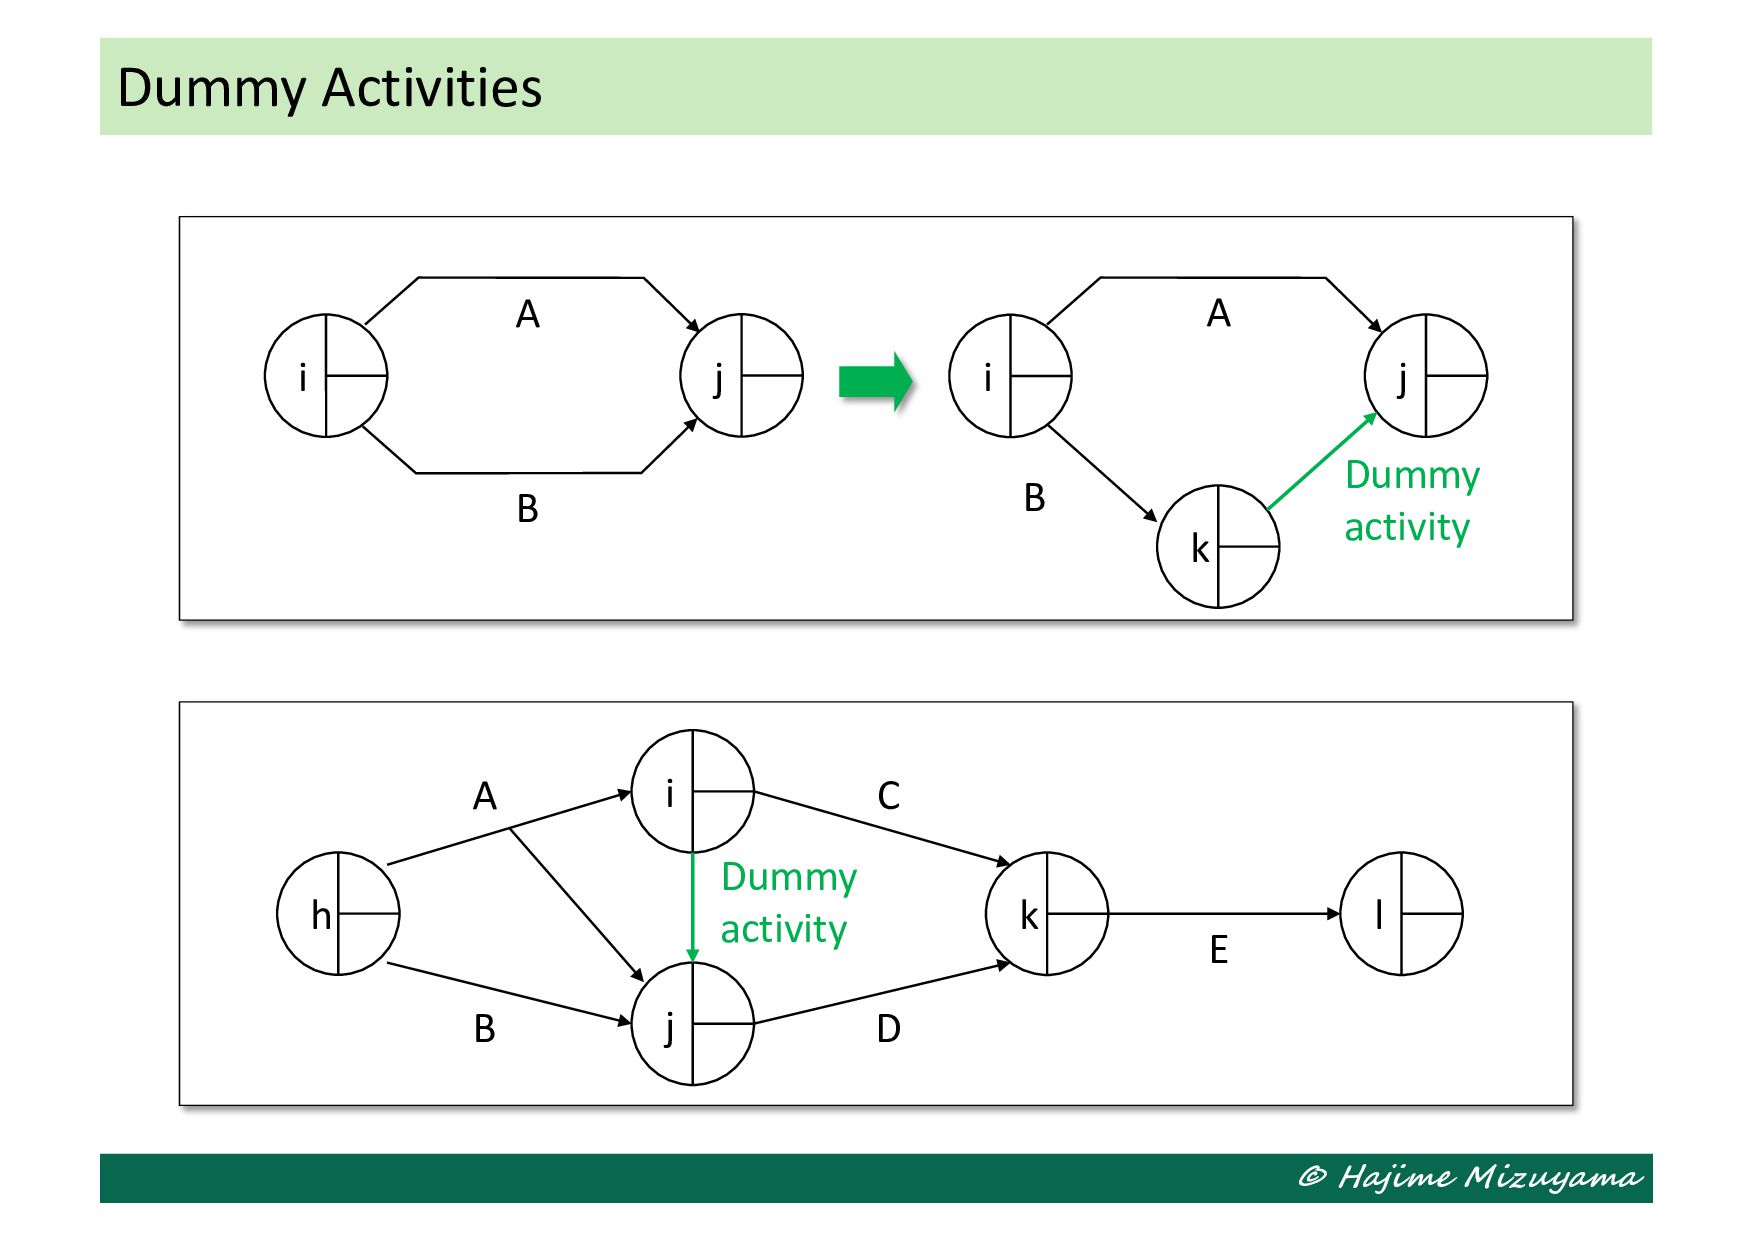
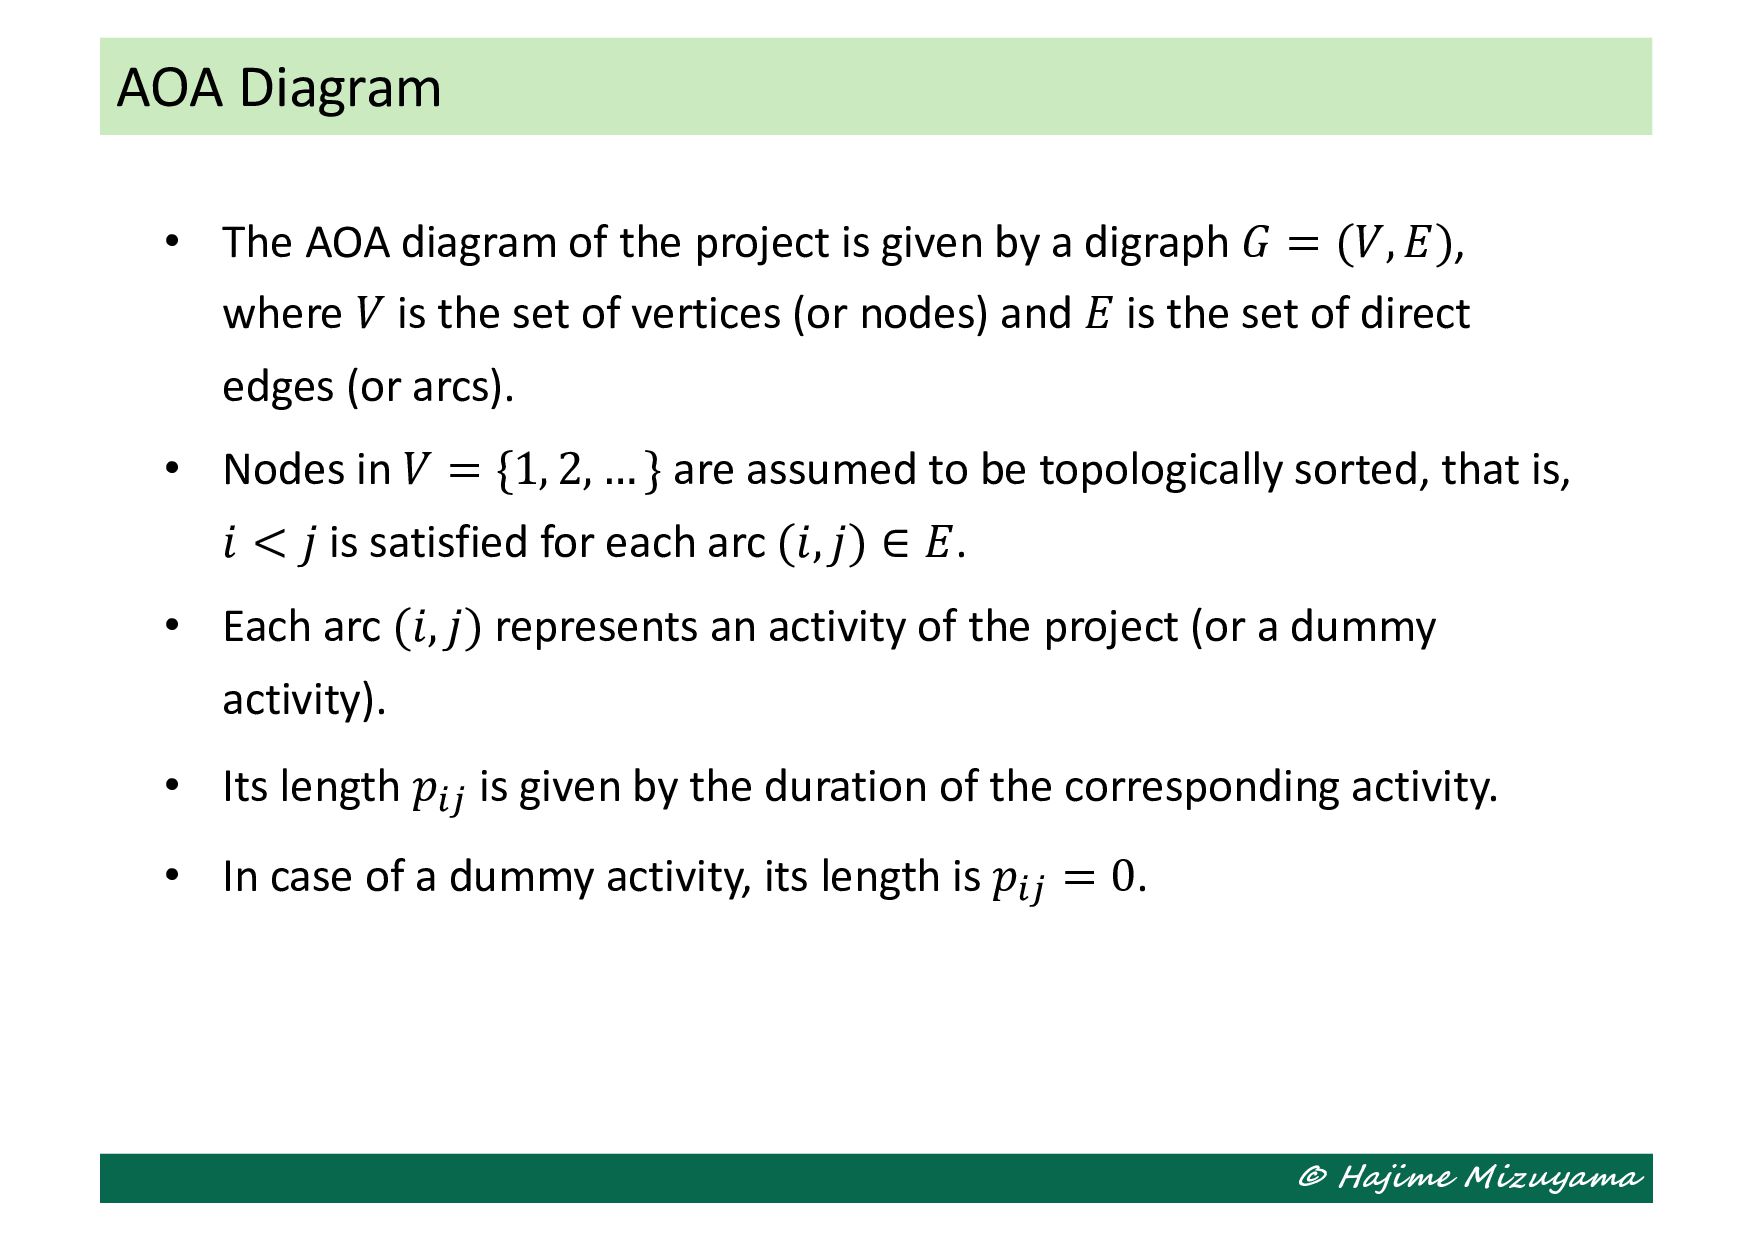
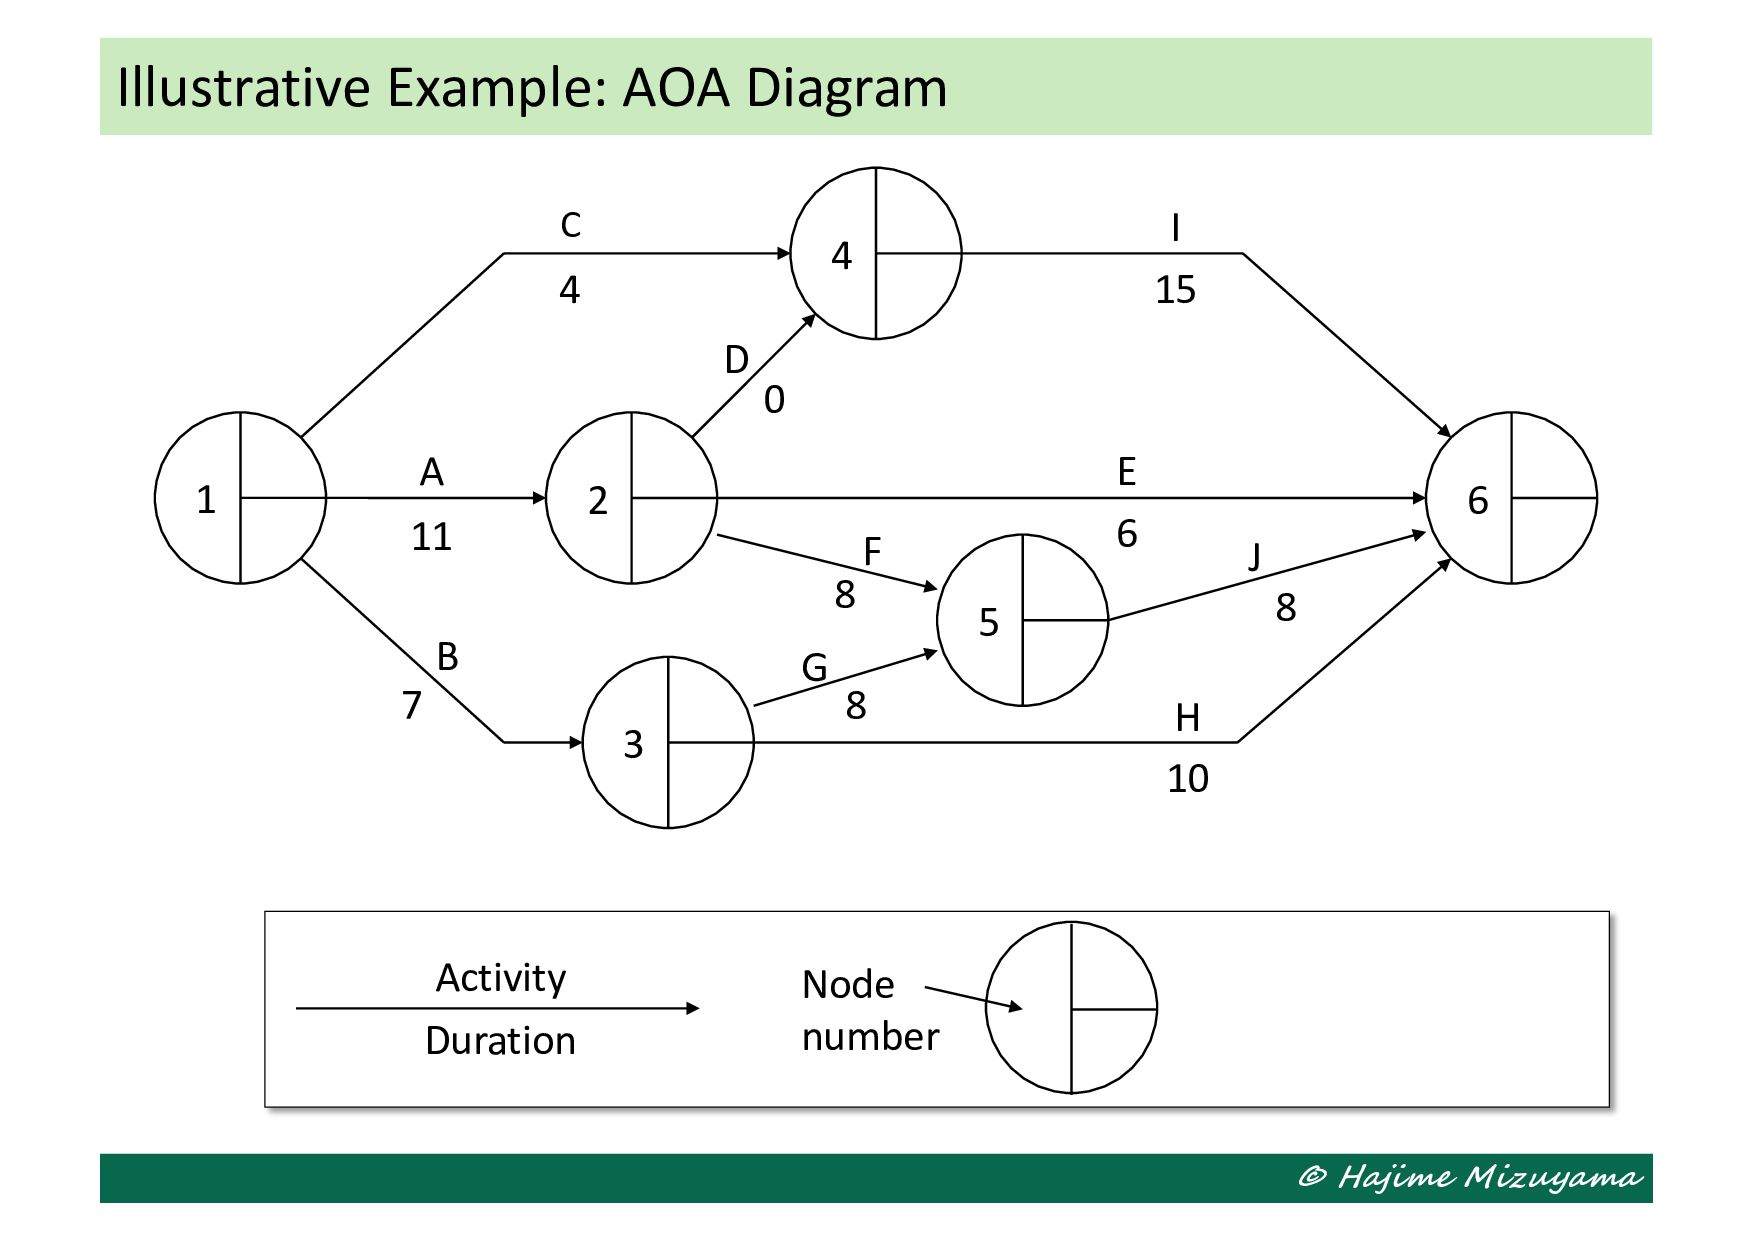
is given by a digraph 𝐺 = (𝑉, 𝐸), where 𝑉 is the set of vertices (or nodes) and 𝐸 is the set of direct edges (or arcs). • Nodes in 𝑉 = {1, 2, … } are assumed to be topologically sorted, that is, 𝑖 < 𝑗 is satisfied for each arc (𝑖, 𝑗) ∈ 𝐸. • Each arc (𝑖, 𝑗) represents an activity of the project (or a dummy activity). • Its length 𝑝!" is given by the duration of the corresponding activity. • In case of a dummy activity, its length is 𝑝!" = 0. AOA Diagram
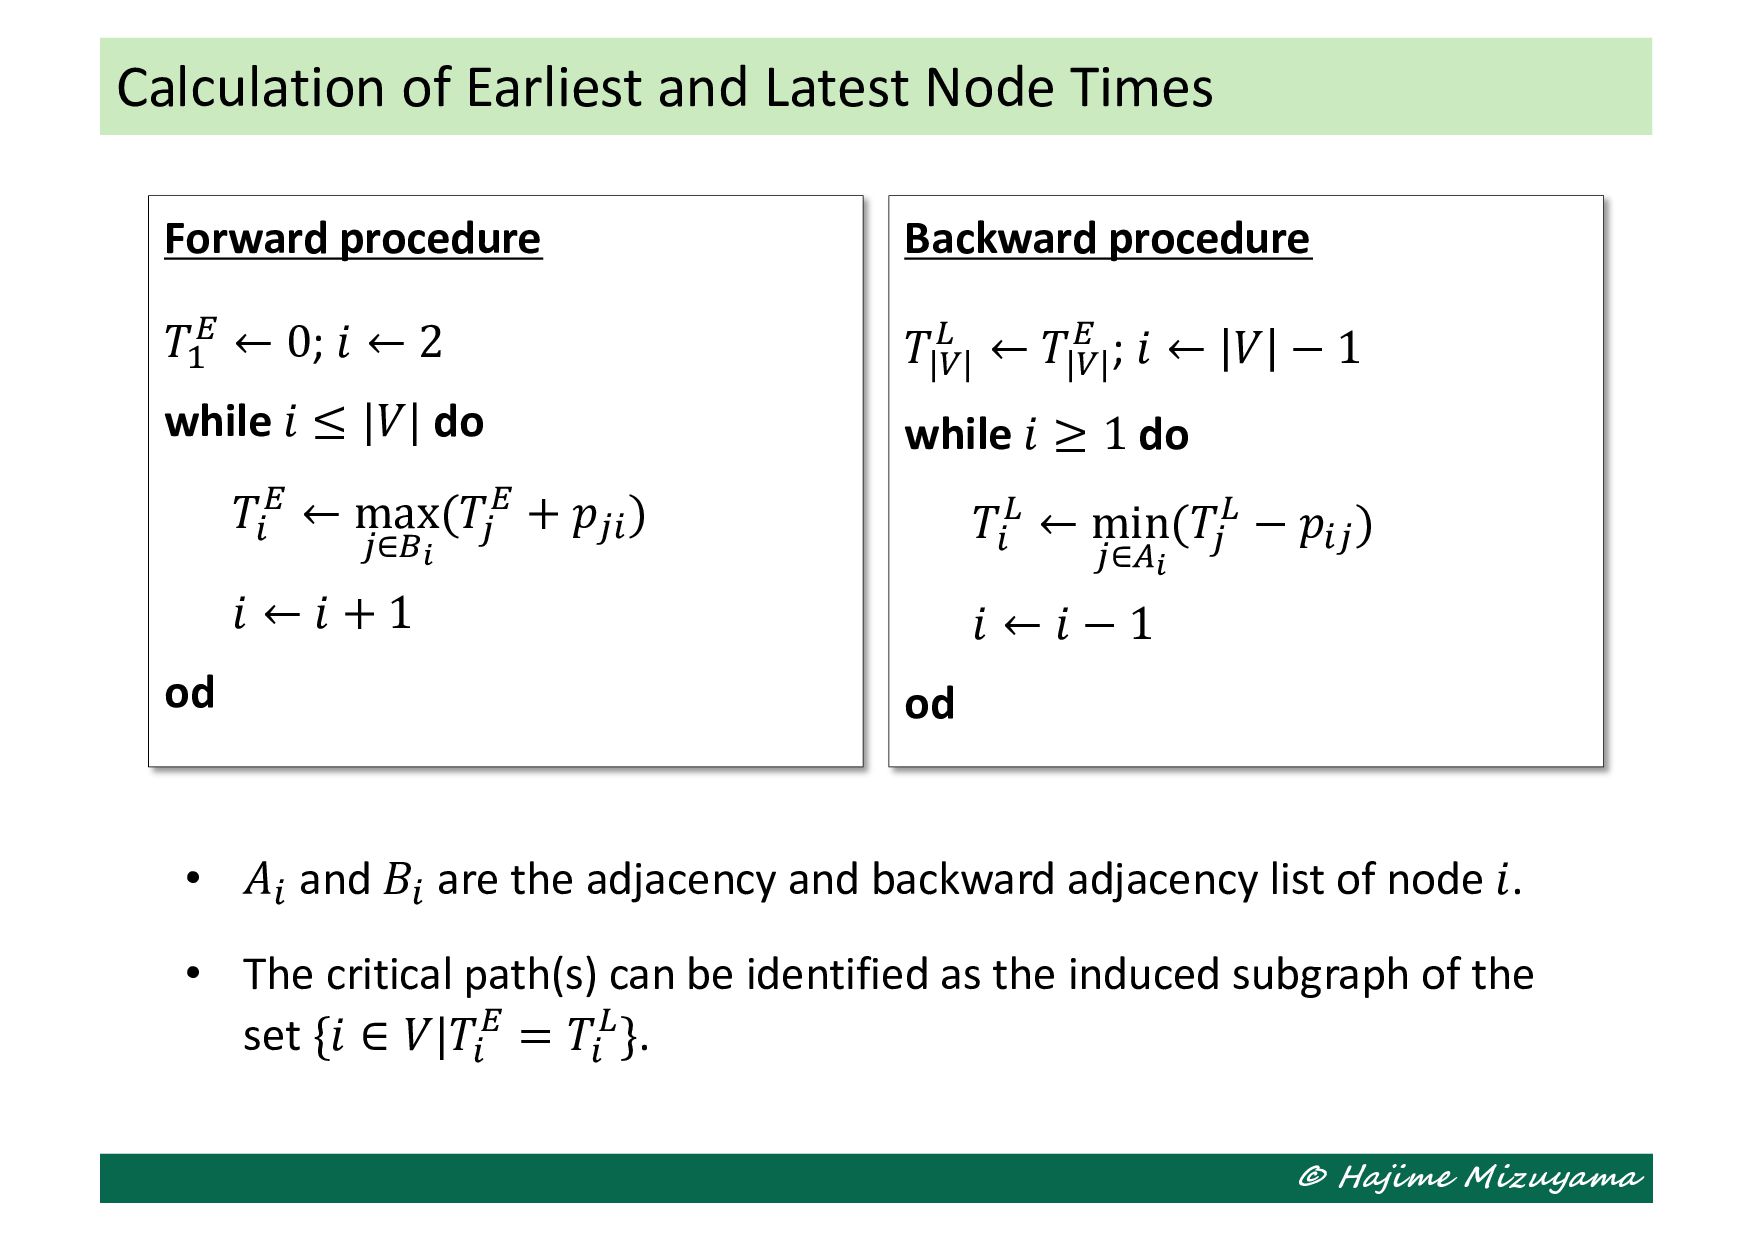
Forward procedure 𝑇# $ ← 0; 𝑖 ← 2 while 𝑖 ≤ |𝑉| do 𝑇! $ ← max "∈&! (𝑇" $ + 𝑝"! ) 𝑖 ← 𝑖 + 1 od Backward procedure 𝑇|(| ) ← 𝑇|(| $ ; 𝑖 ← 𝑉 − 1 while 𝑖 ≥ 1 do 𝑇! ) ← min "∈*! (𝑇" ) − 𝑝!" ) 𝑖 ← 𝑖 − 1 od • 𝐴! and 𝐵! are the adjacency and backward adjacency list of node 𝑖. • The critical path(s) can be identified as the induced subgraph of the set {𝑖 ∈ 𝑉|𝑇! $ = 𝑇! )}.
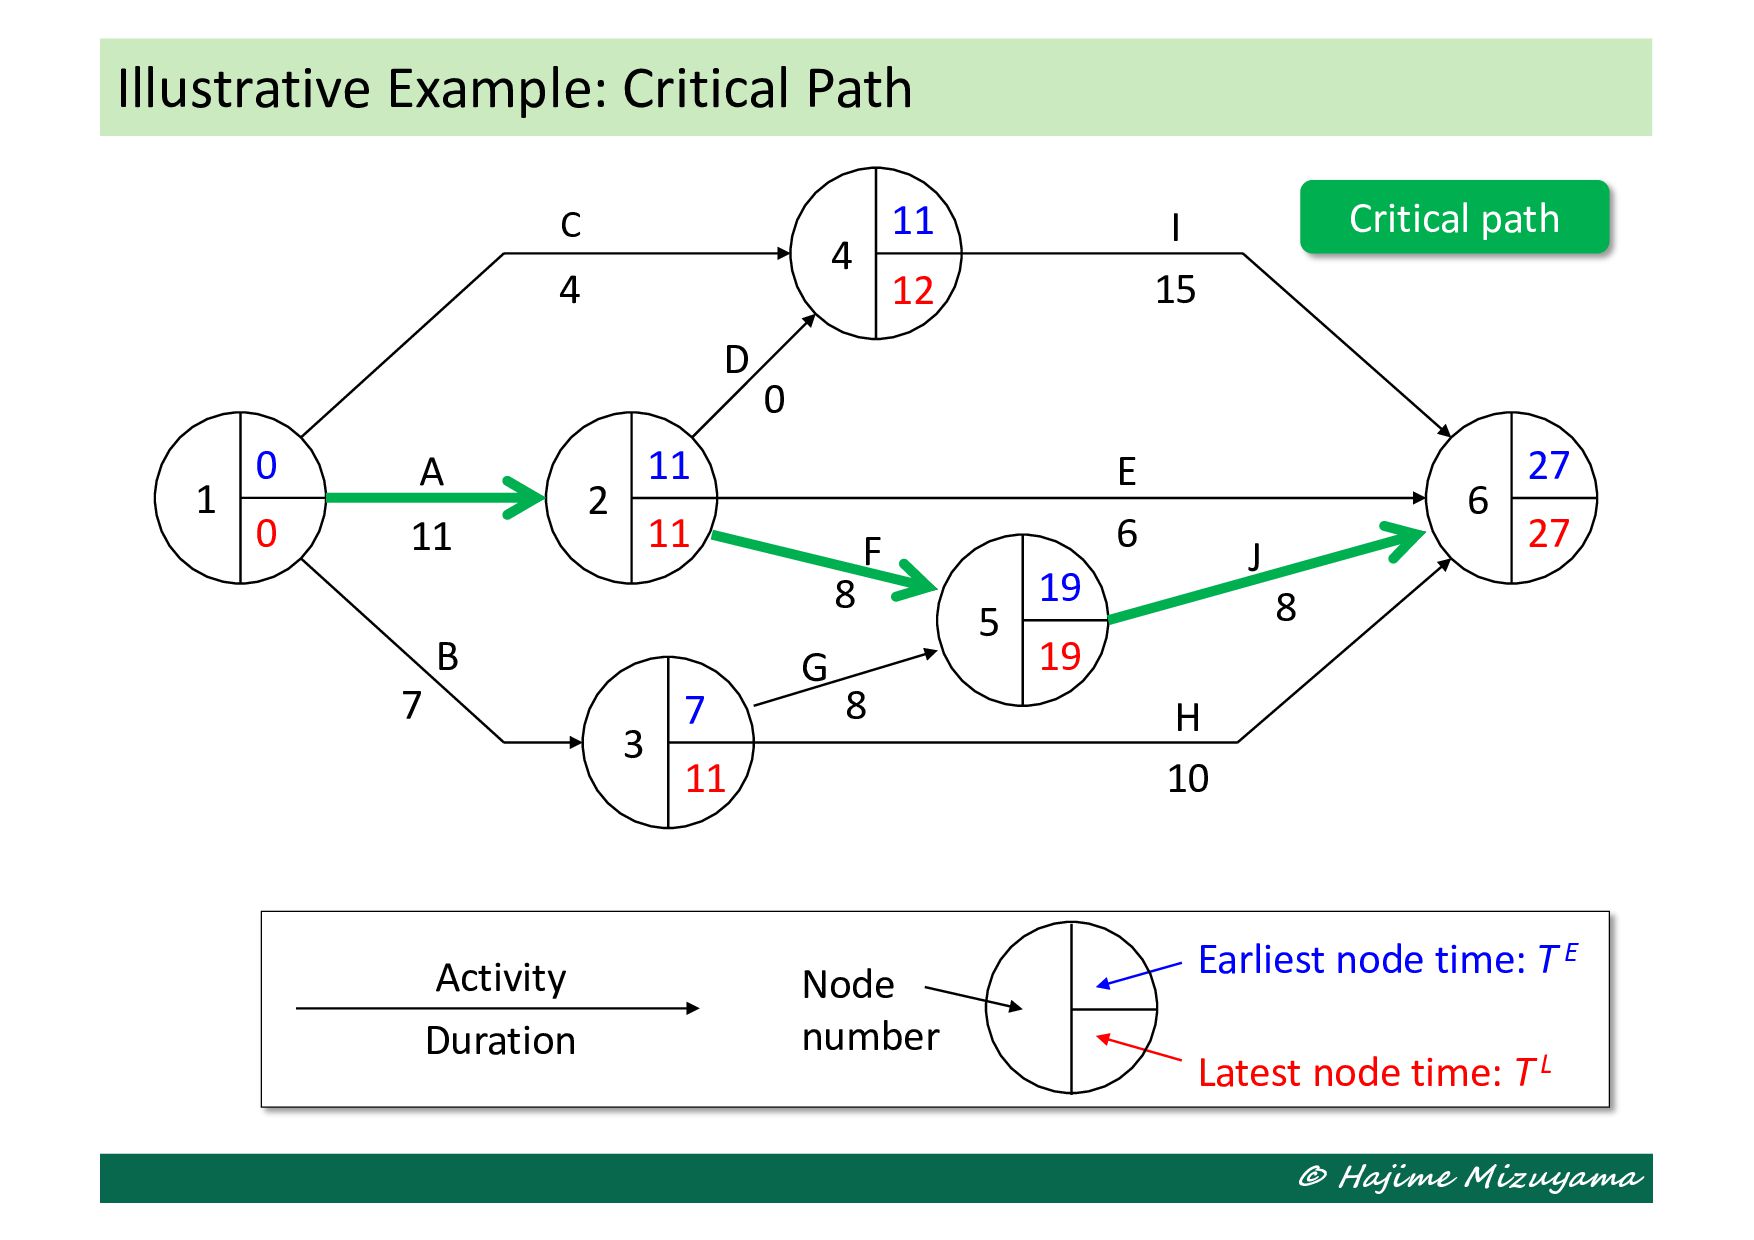
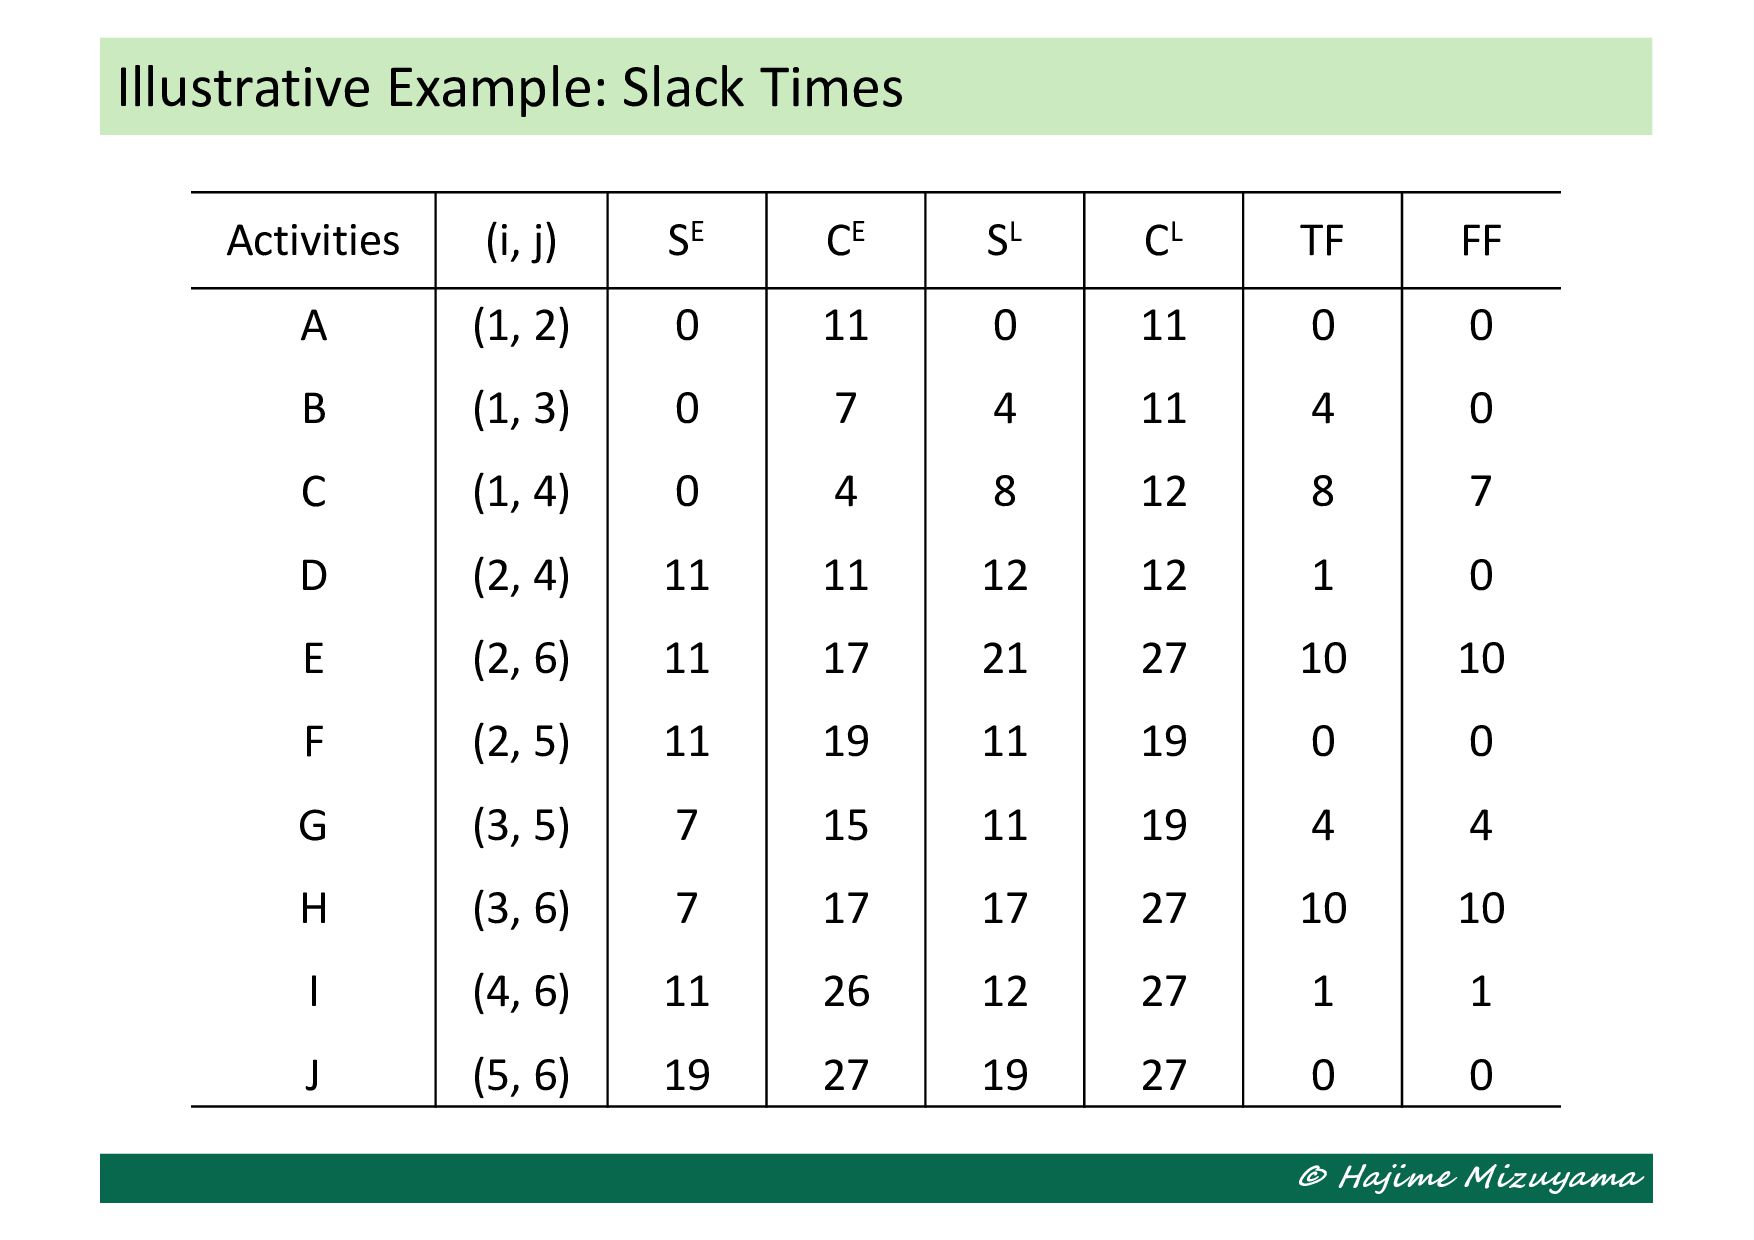
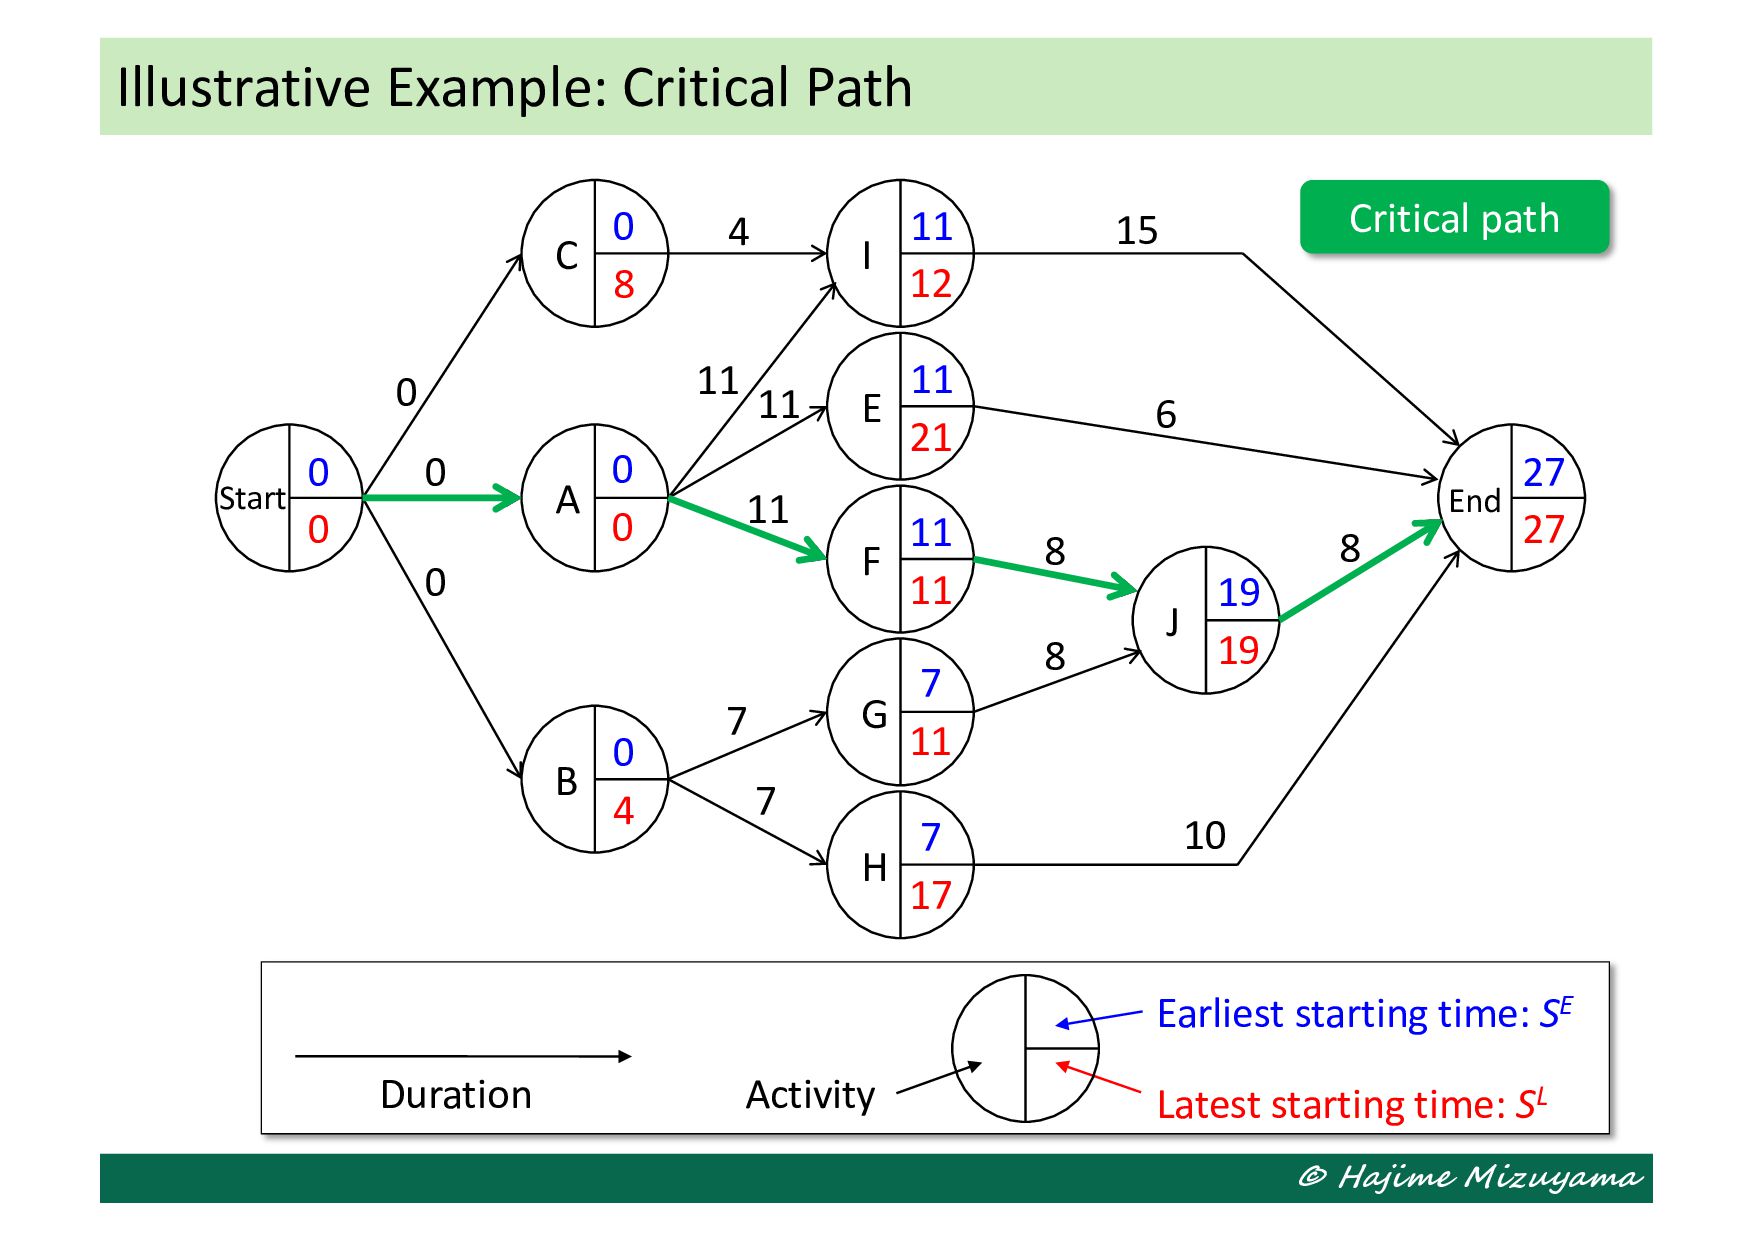
T E Latest node time: T L Node number Activity Duration 6 1 4 2 3 5 0 11 7 11 19 27 27 12 19 11 11 0 Critical path A 4 B 11 C 7 D 15 E 6 F 8 J 8 G 8 H 10 I 0
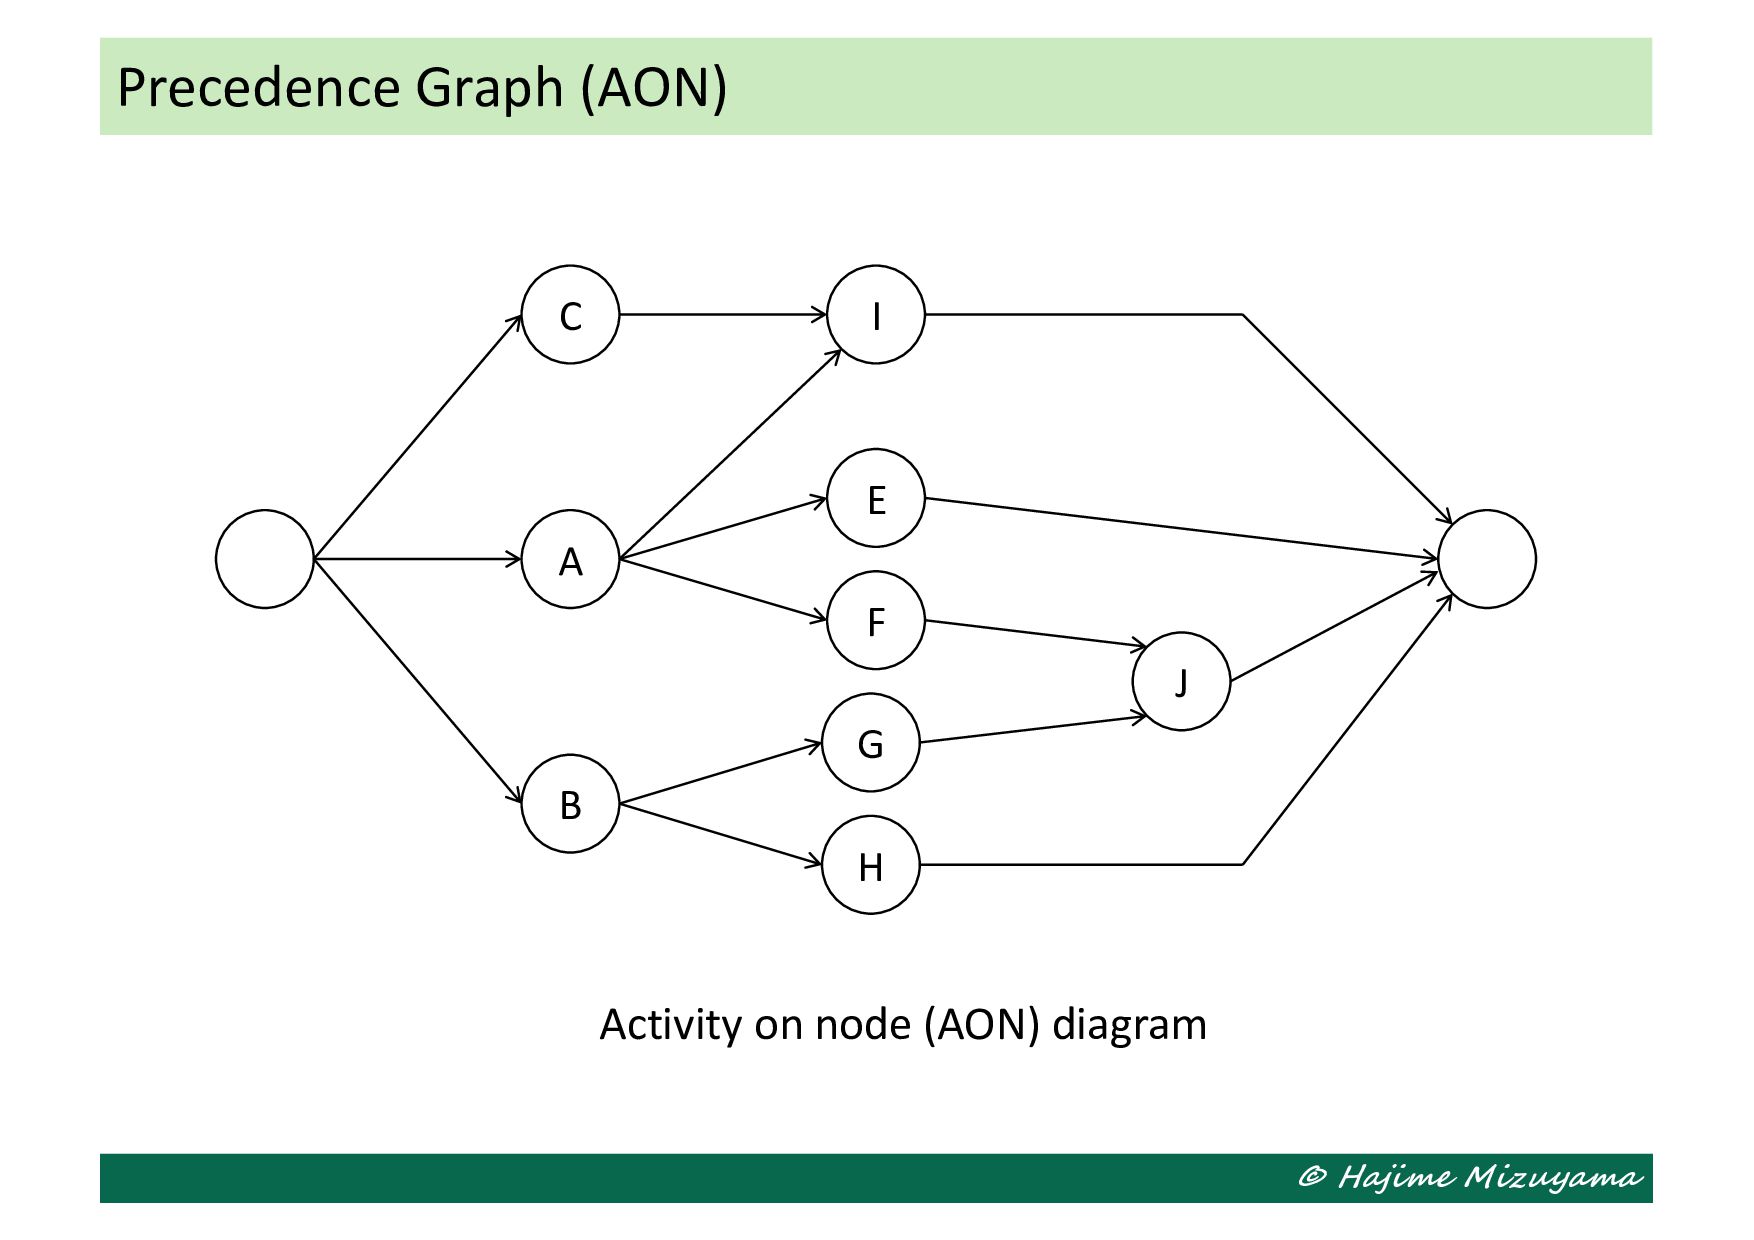
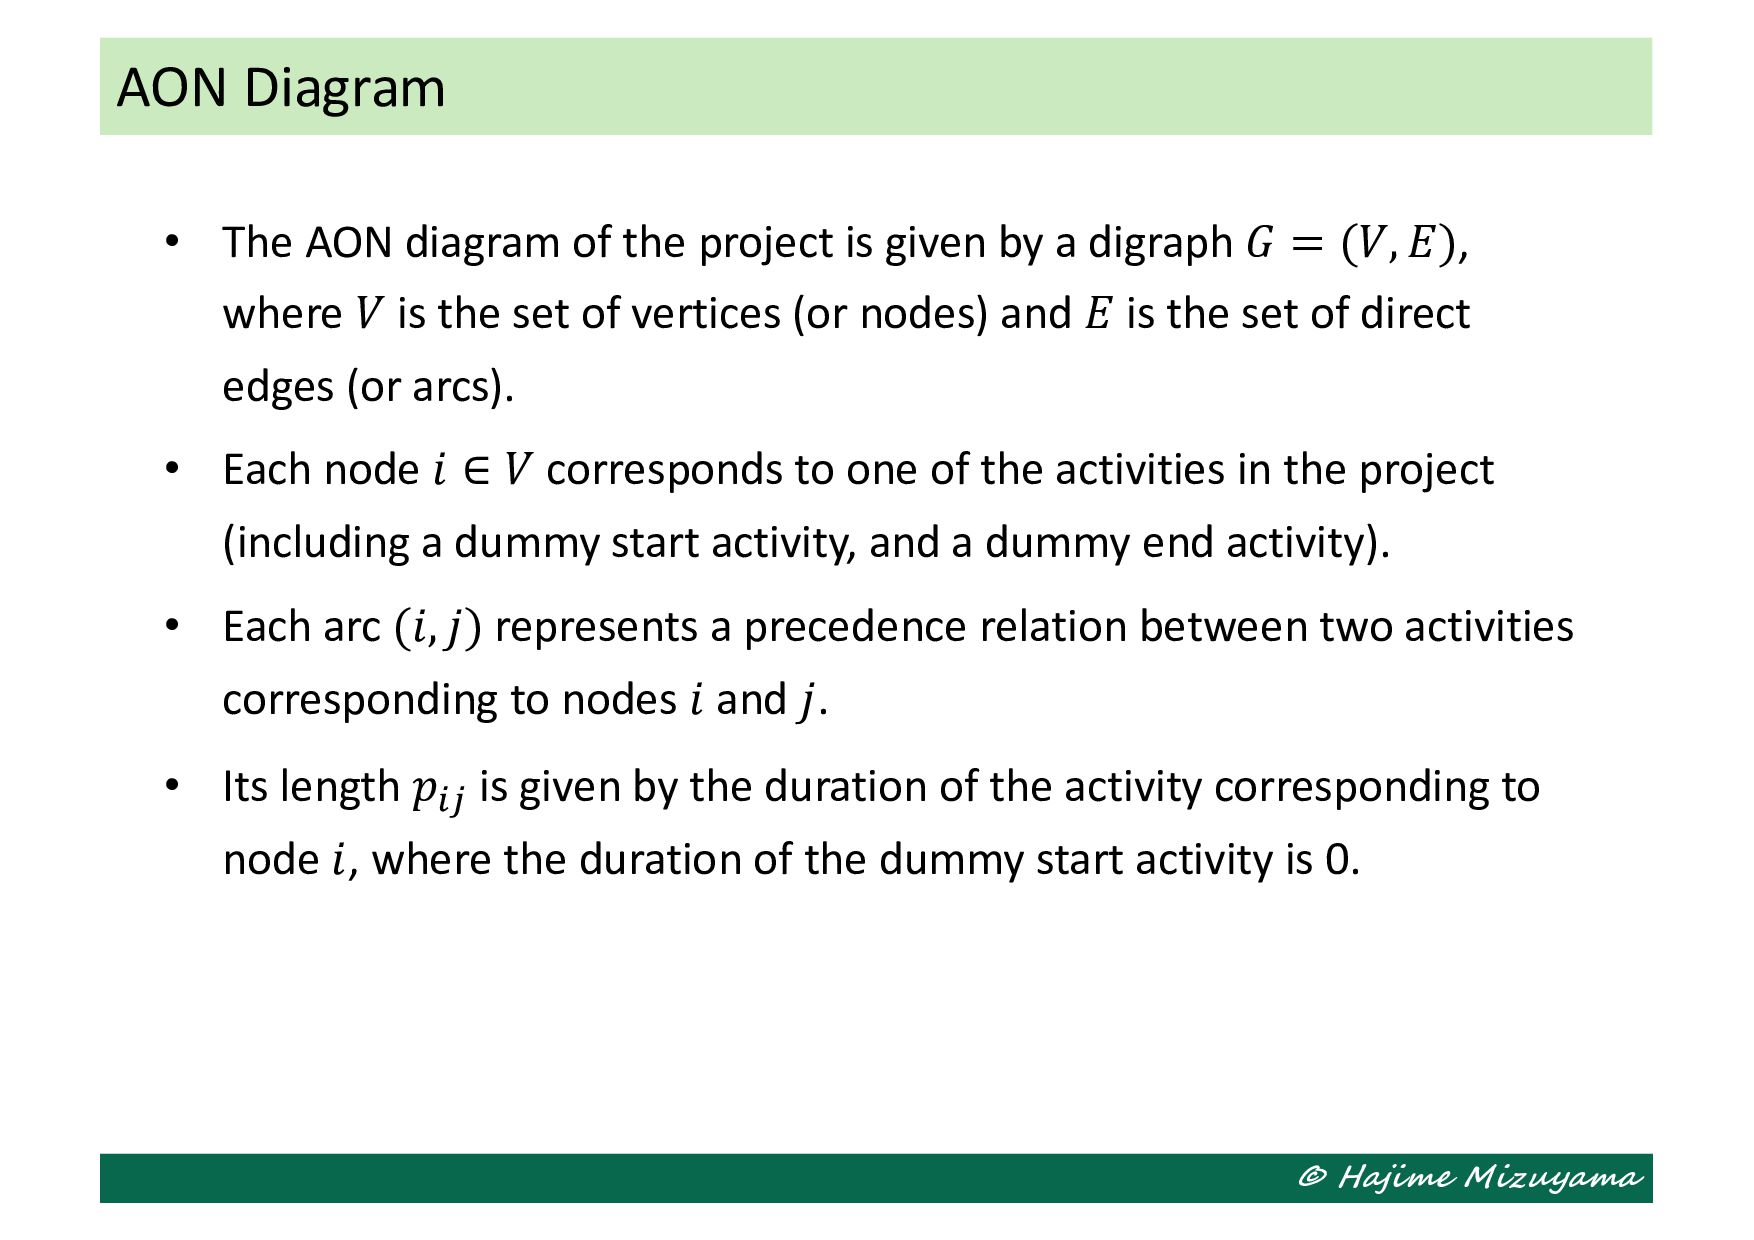
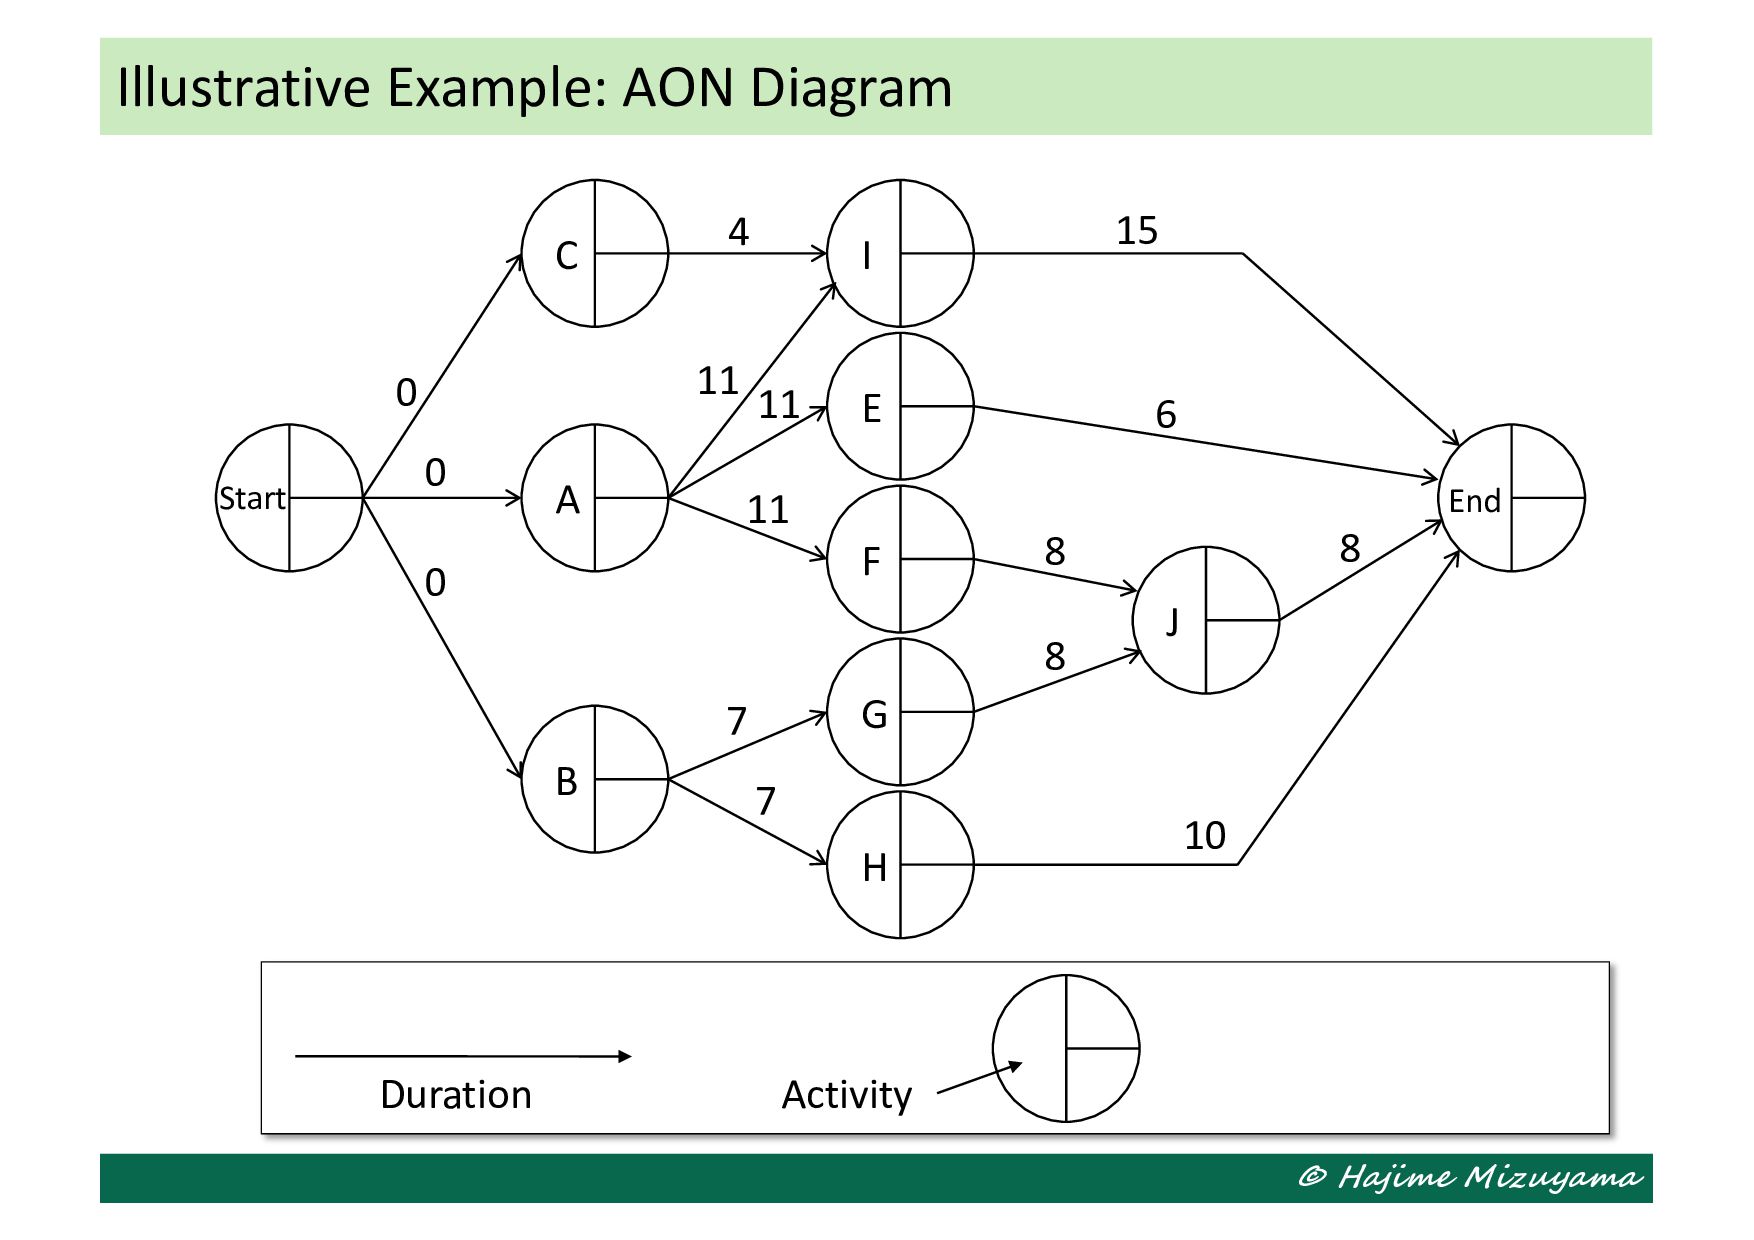
is given by a digraph 𝐺 = (𝑉, 𝐸), where 𝑉 is the set of vertices (or nodes) and 𝐸 is the set of direct edges (or arcs). • Each node 𝑖 ∈ 𝑉 corresponds to one of the activities in the project (including a dummy start activity, and a dummy end activity). • Each arc (𝑖, 𝑗) represents a precedence relation between two activities corresponding to nodes 𝑖 and 𝑗. • Its length 𝑝!" is given by the duration of the activity corresponding to node 𝑖, where the duration of the dummy start activity is 0. AON Diagram
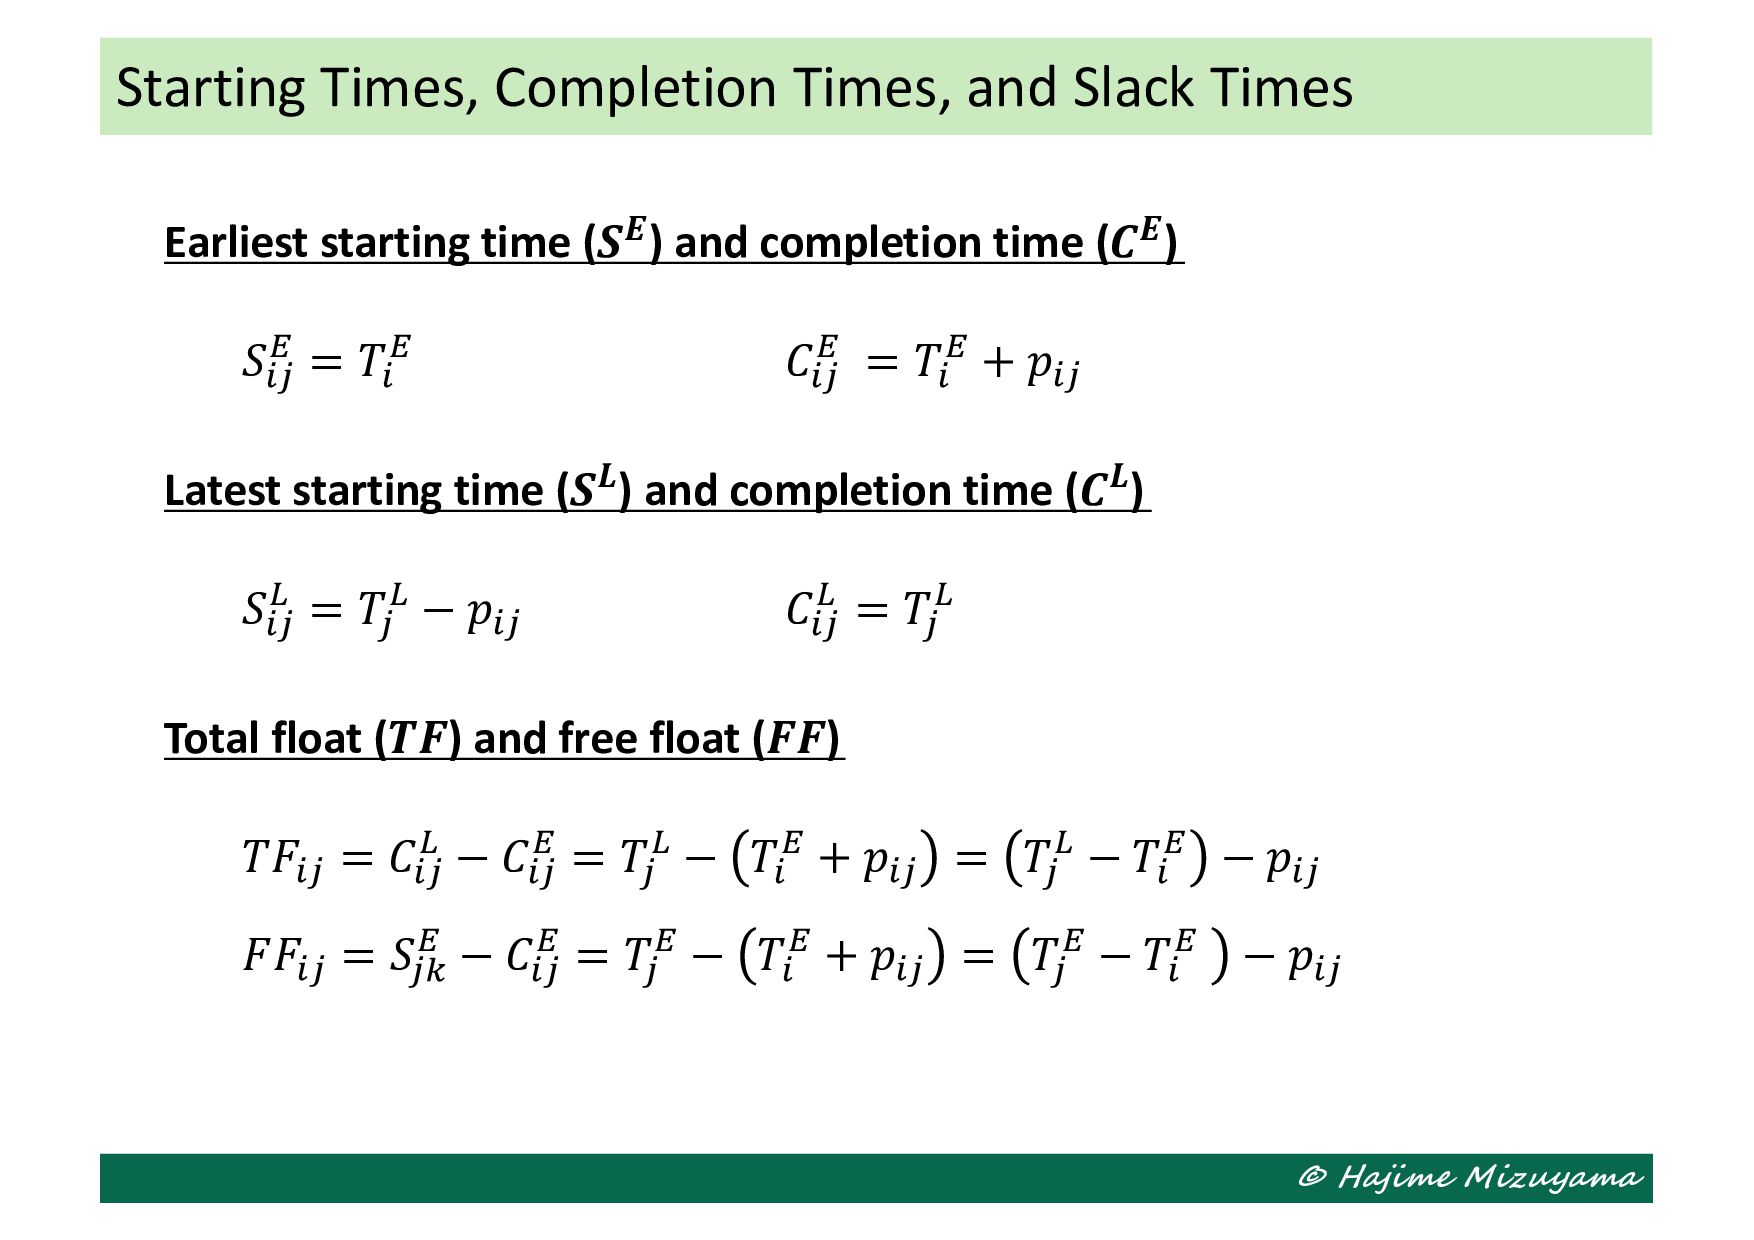
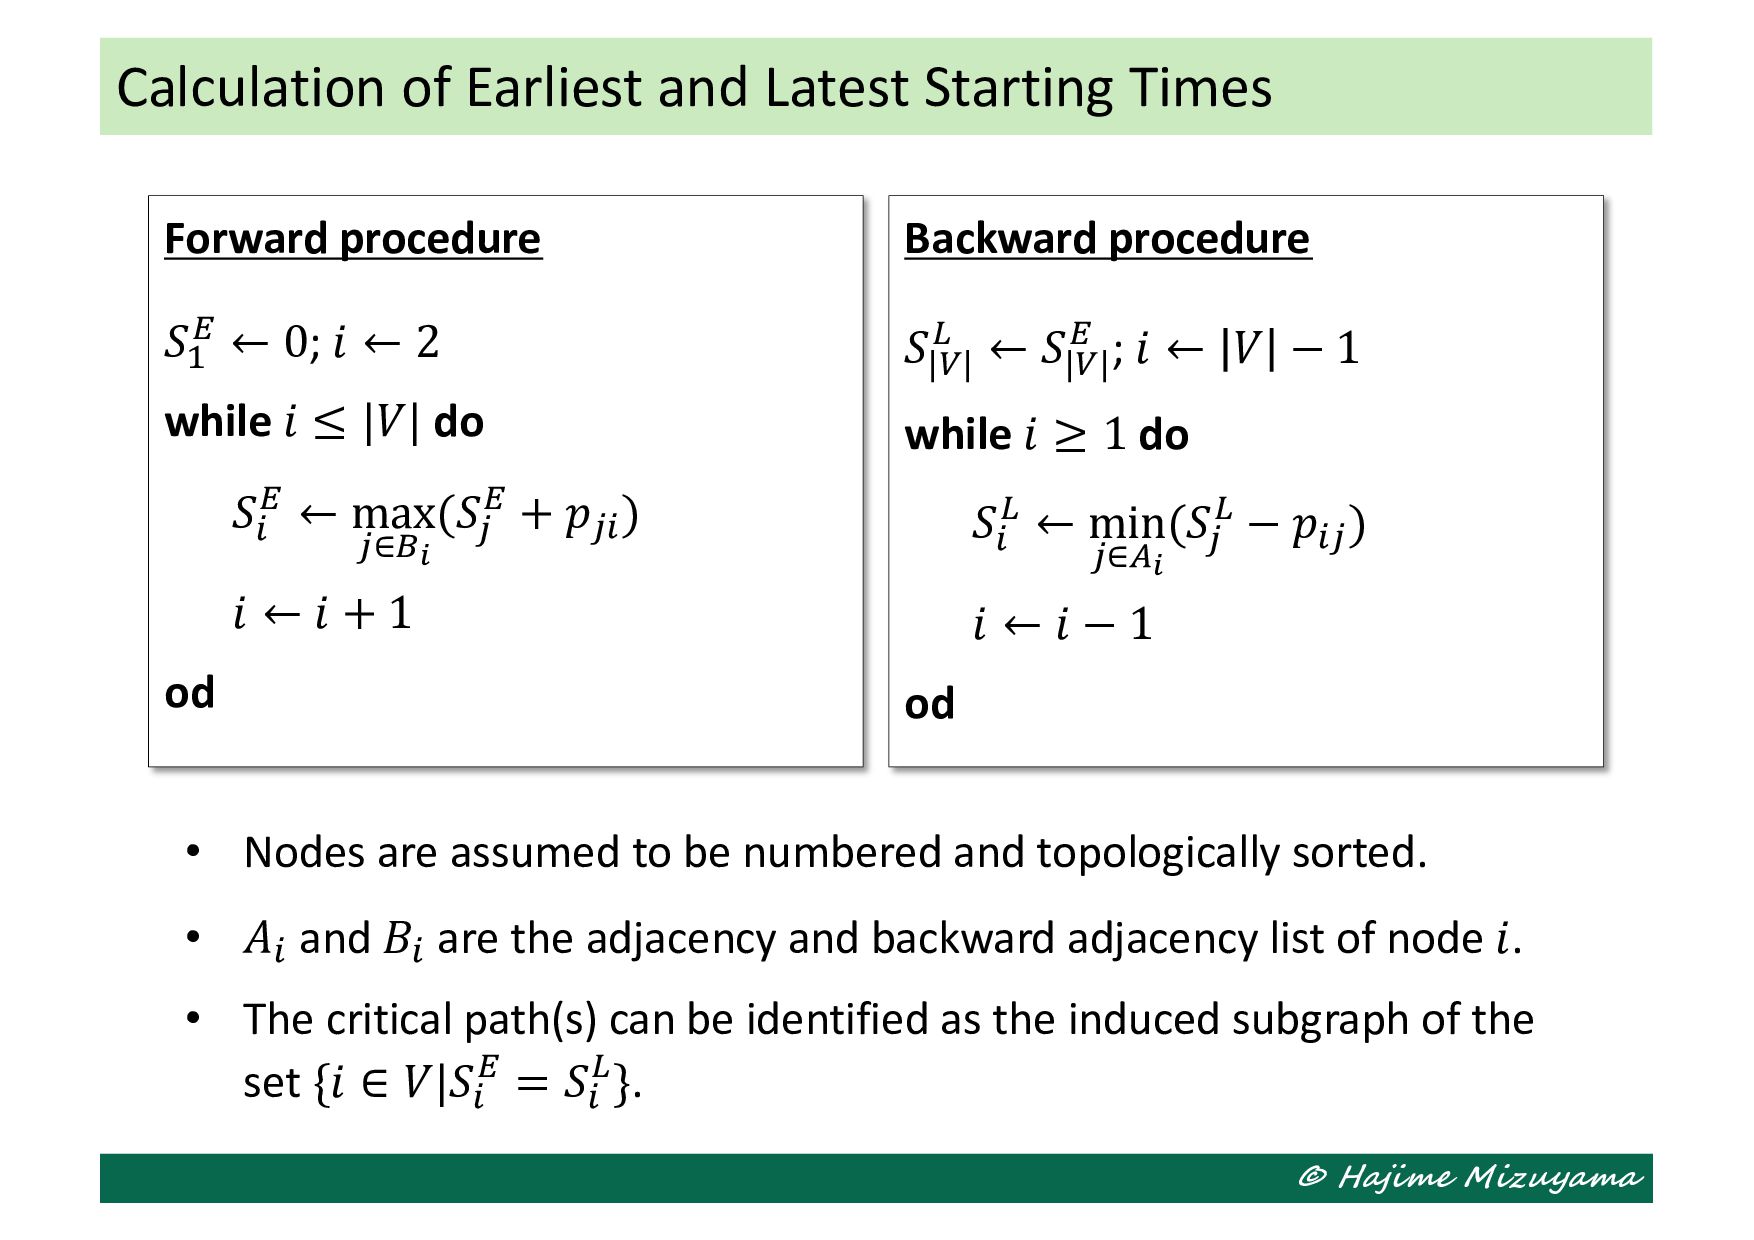
Forward procedure 𝑆# $ ← 0; 𝑖 ← 2 while 𝑖 ≤ |𝑉| do 𝑆! $ ← max "∈&! (𝑆" $ + 𝑝"! ) 𝑖 ← 𝑖 + 1 od Backward procedure 𝑆|(| ) ← 𝑆|(| $ ; 𝑖 ← 𝑉 − 1 while 𝑖 ≥ 1 do 𝑆! ) ← min "∈*! (𝑆" ) − 𝑝!" ) 𝑖 ← 𝑖 − 1 od • Nodes are assumed to be numbered and topologically sorted. • 𝐴! and 𝐵! are the adjacency and backward adjacency list of node 𝑖. • The critical path(s) can be identified as the induced subgraph of the set {𝑖 ∈ 𝑉|𝑆! $ = 𝑆! )}.