Upgrade to Pro — share decks privately, control downloads, hide ads and more …

AAGW3 - Kate Sebastian - eAtlas

CGIAR-CSI
March 21, 2013

AAGW3 - Kate Sebastian - eAtlas

CGIAR-CSI

March 21, 2013
Tweet

More Decks by CGIAR-CSI

Other Decks in Research

Transcript

  1. A collaborative project supported by the CGIAR’s Consortium for Spatial

    Information (CSI), BMGF, HarvestChoice, the Climate Change: Agriculture and Food Security (CCAFS) group and many more who have contributed time and data with technical support from Esri Print version published by IFPRI
  2. A wide-ranging initiative that showcases, through multiple distribution methods, a

    variety of spatial data, tools and services generated by agriculture research and development practitioners working in and for Africa To illustrate the broad scope and availability of knowledge and spatial data capacities that can inform agriculture decision making & highlight the importance of smallholder agriculture in Africa What is the eAtlas? What is the main goal?
  3. • pulling together and sharing data and ideas from R&D

    institutions both within and outside the CGIAR system • opportunity to showcase (not duplicate) the many types of data and the capacity of different teams and … • highlights connections between different research entities • serves as a gateway to other sites and supporting documents of contributors • flexible and can evolve over time in response to changing needs and resources • serves a broad audience through a variety of distribution means What does this really mean?
  4. • Aim: To reach users with different skills, needs, &

    levels of accessibility to the internet • Target audience: Researchers, donors, educators, policymakers, investors, extension workers, citizens, and other decision makers • Formats: Available in hard copy, as a PDF via USB or download, and online through a web-based interface What are the distribution goals?
  5. PDF / Hardcopy Components: - ArcMap template - Export maps

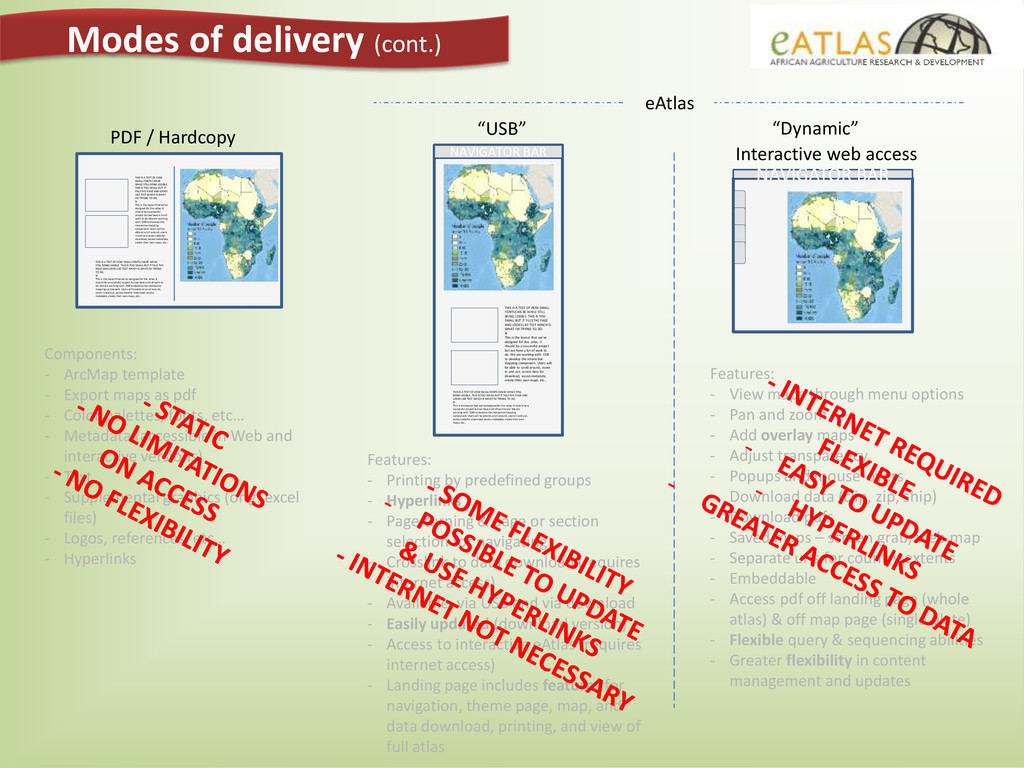
    as pdf - Color palettes, fonts, etc… - Metadata (accessible in Web and interactive versions) - Text - Supplemental graphics (orig. excel files) - Logos, references, etc… - Hyperlinks “Dynamic” NAVIGATOR BAR THIS IS A TEST OF HOW SMALL FONTS CAN BE WHILE STILL BEING LEGIBLE. THIS IS TOO SMALL BUT IT FILLS THE PAGE AND LOOKS LIKE TEST WHICH IS WHAT I’M TRYING TO DO. N This is the layout that we’ve designed for the atlas. It should be a successful project but we have a lot of work to do. We are working with ESRI to develop the interactive mapping component. Users will be able to scroll around, zoom in and out, access data for download, access metadata, create their own maps, etc… THIS IS A TEST OF HOW SMALL FONTS CAN BE WHILE STILL BEING LEGIBLE. THIS IS TOO SMALL BUT IT FILLS THE PAGE AND LOOKS LIKE TEST WHICH IS WHAT I’M TRYING TO DO. N This is the layout that we’ve designed for the atlas. It should be a successful project but we have a lot of work to do. We are working with ESRI to develop the interactive mapping component. Users will be able to scroll around, zoom in and out, access data for download, access metadata, create their own maps, etc… NAVIGATOR BAR THIS IS A TEST OF HOW SMALL FONTS CAN BE WHILE STILL BEING LEGIBLE. THIS IS TOO SMALL BUT IT FILLS THE PAGE AND LOOKS LIKE TEST WHICH IS WHAT I’M TRYING TO DO. N This is the layout that we’ve designed for the atlas. It should be a successful project but we have a lot of work to do. We are working with ESRI to develop the interactive mapping component. Users will be able to scroll around, zoom in and out, access data for download, access metadata, create their own maps, etc… THIS IS A TEST OF HOW SMALL FONTS CAN BE WHILE STILL BEING LEGIBLE. THIS IS TOO SMALL BUT IT FILLS THE PAGE AND LOOKS LIKE TEST WHICH IS WHAT I’M TRYING TO DO. N This is the layout that we’ve designed for the atlas. It should be a successful project but we have a lot of work to do. We are working with ESRI to develop the interactive mapping component. Users will be able to scroll around, zoom in and out, access data for download, access metadata, create their own maps, etc… eAtlas Features: - Printing by predefined groups - Hyperlinks - Page turning & page or section selection for navigating - Crosslink to data download (requires internet access) - Available via USB and via download - Easily updated (download version) - Access to interactive eAtlas (requires internet access) - Landing page includes features for navigation, theme page, map, and data download, printing, and view of full atlas Features: - View maps through menu options - Pan and zoom - Add overlay maps - Adjust transparency - Popups and mouse-overs - Download data (clip, zip, ship) - Download pdfs - Saved maps – screen grab, web map - Separate urls for country extents - Embeddable - Access pdf off landing page (whole atlas) & off map page (single plate) - Flexible query & sequencing abilities - Greater flexibility in content management and updates Interactive web access “USB” Modes of delivery (cont.)
  6. Organization • 6 themes comprised of multiple data summaries •

    Each data summary contains mapped data plus supporting text & graphics that puts the data in context • The text is in a standard format and answers four questions: • What is the map telling us? • Why is this important? • What about the underlying data? • Where can I learn more? What is the value added?
  7. What data are included? • Administrative Boundaries • Statistical Groupings

    • Institutional Groupings • Donor Priority Countries • Africa’s Public Agriculture R&D Investments • Africa’s Agriculture Research Pool • African Agriculture Investment Plan (NEPAD/CAADP) • CGIAR Research Programs • Farming Systems • Crop and Pasture Density • Cereal Crop Distribution • Root & Tuber Crop Distribution • Milk Production • Biomass Consumption by Livestock • Livestock & Mixed Crop-Livestock Systems • Land Productivity of Staple Food Crop Areas • Agroecological Zones • Maize Yield Potential • Rainfall & Yield Variability • Water Management • Soil Fertility • Accessing Local Markets: Market Accessibility & Marketsheds • Accessing International Markets: Ports & Portsheds RESOURCES & ECOSYSTEM SERVICES • Global Hunger Index 2012 • Poverty Distribution • Rainfall & Rainfall variability • Land Degradation • Water Use by Livestock • Manure Application • Methane Emissions: Livestock • Methane Emissions: Rice • Impacts of Climate Change on Length of Growing Period Global Yield Gaps Germplasm Collection Missions What data are included?
  8. • Opportunity to share knowledge • Tells a consolidated story

    of the work related agriculture R&D in Africa • Gateway to existing data holdings and research - more than just a repository of existing data & resources • Allows contributors to maintain control of how data is defined and used while still being part of a consolidated effort • Pathway to ‘open access’ What are the benefits of contributing?
  9. • Preview of 10 data summaries – March 2013 •

    Print version of atlas with more than 30 data summaries scheduled for publication in late 2013; to be released with the static viewer • Followed by a beta version of the interactive eAtlas Currently … • Working with contributors to finalize the additional data summaries • Seeking additional participants (support and contributors) • Working with IFPRI communications team on the USB ‘viewer’ • Exploring options for the online interactive mapping tool • Helping launch country level initiatives • Developing a revised plan & timeline for the initiative Where are we now?
  10. • Administrative Boundaries • Statistical Groupings • Institutional Groupings •

    Donor Priority Countries • Africa’s Public Agriculture R&D Investments • Africa’s Agriculture Research Pool • African Agriculture Investment Plan (NEPAD/CAADP) • CGIAR Research Programs • Farming Systems • Crop and Pasture Density • Cereal Crop Distribution • Root & Tuber Crop Distribution • Milk Production • Biomass Consumption by Livestock • Livestock & Mixed Crop-Livestock Systems • Land Productivity of Staple Food Crop Areas • Agroecological Zones • Maize Yield Potential • Rainfall & Yield Variability • Water Management • Soil Fertility • Market Accessibility • Accessing Local Markets: Market Accessibility & Marketsheds • Accessing International Markets: Ports & Portsheds • Global Hunger Index 2012 • Poverty Distribution • Rainfall & Rainfall variability • Land Degradation • Water Use by Livestock • Manure Application • Methane Emissions: Livestock • Methane Emissions: Rice • Impacts of Climate Change on Length of Growing Period Pre-release content RESOURCES & ECOSYSTEM SERVICES • Administrative Boundaries • Statistical Groupings • Institutional Groupings • Donor Priority Countries • Africa’s Public Agriculture R&D Investments • Africa’s Agriculture Research Pool • African Agriculture Investment Plan (NEPAD/CAADP) • CGIAR Research Programs • Farming Systems • Crop and Pasture Density • Cereal Crop Distribution • Root & Tuber Crop Distribution • Milk Production • Biomass Consumption by Livestock • Livestock & Mixed Crop-Livestock Systems • Land Productivity of Staple Food Crop Areas • Agroecological Zones • Maize Yield Potential • Rainfall & Yield Variability • Water Management • Soil Fertility • Market Accessibility • Accessing Local Markets: Market Accessibility & Marketsheds • Accessing International Markets: Ports & Portsheds • Global Hunger Index 2012 • Poverty Distribution • Rainfall & Rainfall variability • Land Degradation • Water Use by Livestock • Manure Application • Methane Emissions: Livestock • Methane Emissions: Rice • Impacts of Climate Change on Length of Growing Period
  11. Interested in participating in the initiative by providing support or

    data please contact: Kate Sebastian Consultant, BMGF [email protected] Questions about the data summaries or the process in general please email: [email protected]