Upgrade to Pro
— share decks privately, control downloads, hide ads and more …
Speaker Deck
Features
Speaker Deck
PRO
Sign in
Sign up for free
Search
Search
Making forest and funnel plots
Search
Graeme Hickey
October 03, 2016
Research
160
0
Share
Embed
Copy iframe code
Copy JS code
Copy link
Start on current slide
Making forest and funnel plots
Presented at the 30th Annual EACTS Meeting, Barcelona, Spain (1-5 October 2016)
Graeme Hickey
October 03, 2016
More Decks by Graeme Hickey
See All by Graeme Hickey
Joint modelling of longitudinal and time-to-event data: recent extensions
graemeleehickey
0
480
Risk: a statistician's viewpoint
graemeleehickey
1
1.5k
Joint modelling of multivariate longitudinal and time-to-event data
graemeleehickey
0
480
A comparison of joint models for longitudinal and competing risks data, with application to an epilepsy drug randomized controlled trial
graemeleehickey
0
240
Dynamic survival prediction for multivariate joint models using the R package joineRML
graemeleehickey
0
810
Joint modelling of multivariate longitudinal and time-to-event data
graemeleehickey
0
390
What you need to know about statistics to read a journal article
graemeleehickey
1
490
Checking model assumptions with regression diagnostics
graemeleehickey
1
310
Performing repeated measures analysis
graemeleehickey
0
390
Other Decks in Research
See All in Research
長時間動画QAにおけるマルチエージェント推論 ・SVAgent: Storyline-Guided Long Video Understanding via Cross-Modal Multi-Agent Collaboration
murakawatakuya
1
160
「AIとWhyを深堀る」をAIと深堀る
iflection
0
520
【Zozo Research 技術共有会】三次元領域の現在と展望
mickey_0226
3
460
第64回CV・PRML勉強会 論文紹介:Linguistic Priors for Visual Decoupling: Towards Symmetric Vision-Brain Alignment
sokikatayama
0
130
討議:RACDA設立30周年記念都市交通フォーラム2026
trafficbrain
0
1k
2026年3月1日(日)福島「除染土」の公共利用をかんがえる
atsukomasano2026
0
660
NLP colloquium: AI Safety Survey
kanekomasahiro
0
830
英語教育 “研究” のあり方:学術知とアウトリーチの緊張関係
terasawat
1
1k
敵対生成プロンプト同時探索による内省型プロンプト最適化
kinoue_smarthr
0
290
NII S. Koyama's Lab Research Overview AY2026
skoyamalab
0
390
2026 東京科学大 情報通信系 研究室紹介 (大岡山)
icttitech
0
4k
「行ける・行けない表」による地域公共交通の性能評価
bansousha
0
170
Featured
See All Featured
Groundhog Day: Seeking Process in Gaming for Health
codingconduct
0
240
A Guide to Academic Writing Using Generative AI - A Workshop
ks91
PRO
1
350
The Illustrated Guide to Node.js - THAT Conference 2024
reverentgeek
1
410
[SF Ruby Conf 2025] Rails X
palkan
2
1.1k
A designer walks into a library…
pauljervisheath
211
24k
Visualizing Your Data: Incorporating Mongo into Loggly Infrastructure
mongodb
49
10k
What’s in a name? Adding method to the madness
productmarketing
PRO
24
4.1k
Building a A Zero-Code AI SEO Workflow
portentint
PRO
0
630
Fashionably flexible responsive web design (full day workshop)
malarkey
408
66k
How to Talk to Developers About Accessibility
jct
2
290
The Mindset for Success: Future Career Progression
greggifford
PRO
0
410
The World Runs on Bad Software
bkeepers
PRO
72
12k
Transcript
Meta-analysis from start to finish Graeme L. Hickey* Department of
Biostatistics, University of Liverpool * No conflicts of interest
None
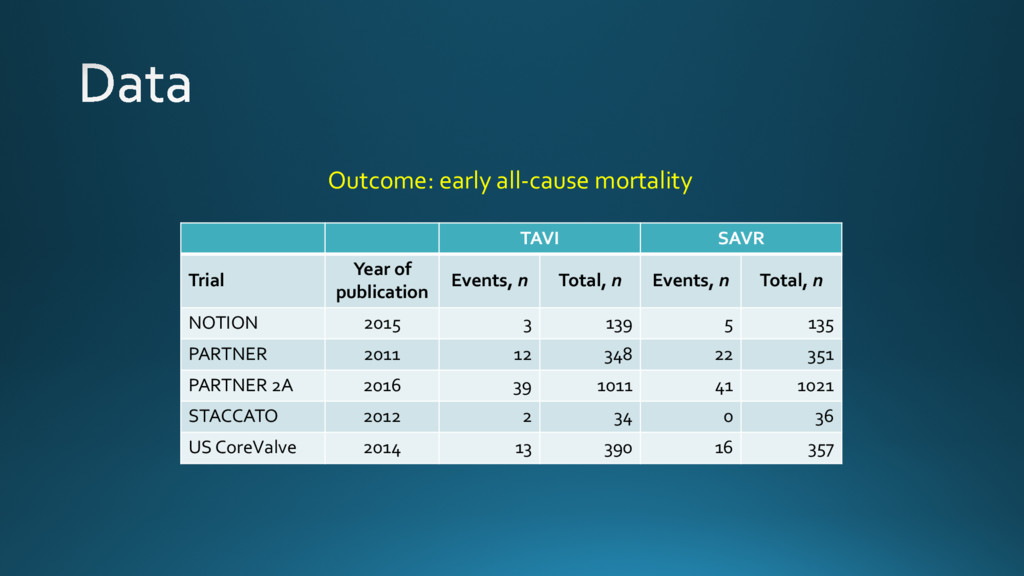
Early all-cause mortality Five randomized trials
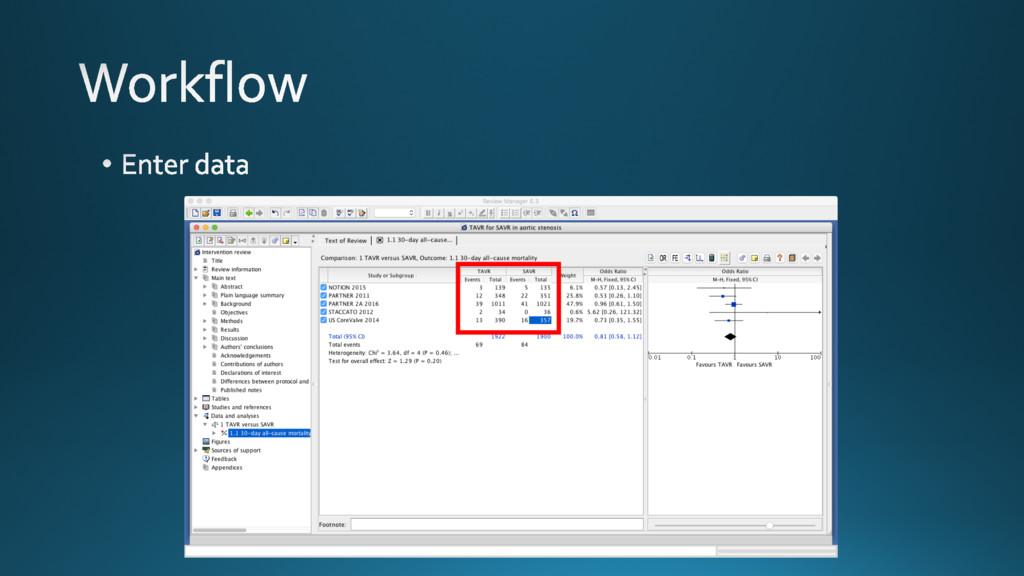
TAVI SAVR Trial Year of publication Events, n Total, n
Events, n Total, n NOTION 2015 3 139 5 135 PARTNER 2011 12 348 22 351 PARTNER 2A 2016 39 1011 41 1021 STACCATO 2012 2 34 0 36 US CoreValve 2014 13 390 16 357 Outcome: early all-cause mortality
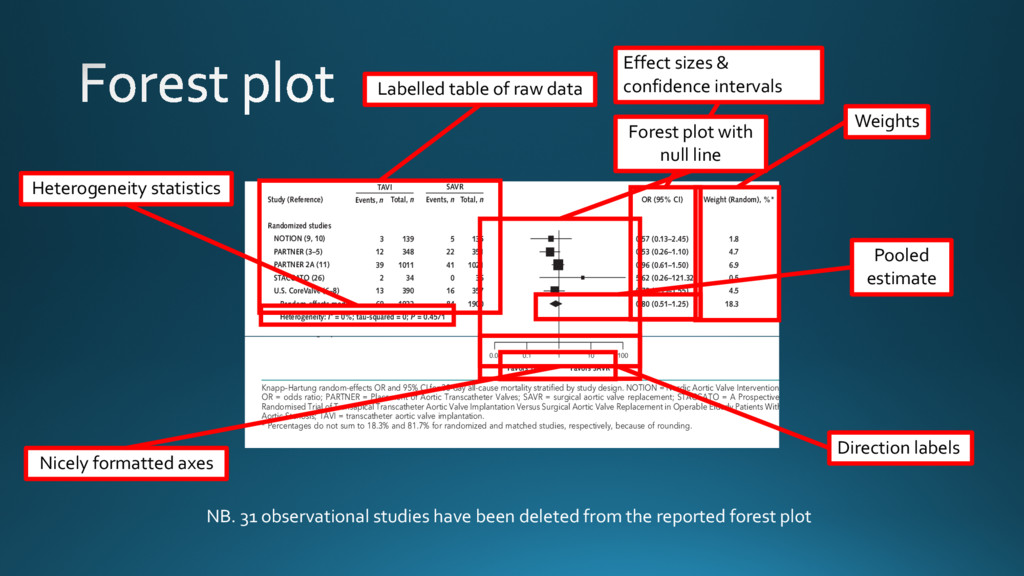
Jones et al (39) Kobrin et al (40) Latib et
al (12) Minutello et al (41) Muneretto et al (42) Onorati et al (43) Osnabrugge et al (13) Papadopoulos et al (44) Piazza et al (14) Santarpino et al (45) Schymik et al (15) Stöhr et al (46) Tamburino et al (16) Thakkar et al (47) Thongprayoon et al (48) Thourani et al (17) Walther et al (49) Wendt et al (50) Zweng et al (51) Random-effects model Heterogeneity: l2 = 39.3%; tau-squared = 0.1507; P = 0.017 Random-effects model Heterogeneity: l2 = 37%; tau-squared = 0.1253; P = 0.0172 Test for overall effect: P = 0.9041 Test for subgroup differences: Q = 2.2; P = 0.1415 0 20 2 20 20 1 2 3 33 3 3 21 20 2 3 12 10 9 2 287 356 1.37 (0.68–2.77) 1.00 (0.14–7.23) 1.34 (0.79–2.30) 2.23 (1.16–4.27) 3.11 (0.12–79.64) 0.65 (0.10–4.10) 0.46 (0.11–1.98) 1.35 (0.79–2.31) 0.59 (0.14–2.53) 0.32 (0.09–1.21) 1.70 (0.82–3.51) 0.83 (0.45–1.51) 1.00 (0.13–7.60) 1.51 (0.25–9.12) 0.27 (0.14–0.52) 0.63 (0.27–1.48) 2.72 (0.69–10.63) 1.00 (0.13–7.43) 1.08 (0.84–1.38) 1.01 (0.81–1.26) 0.0 4.8 1.1 6.1 5.2 0.4 1.2 1.8 6.1 1.8 2.1 4.6 5.5 1.0 1.3 5.1 3.9 2.0 1.0 81.7 100 0 15 2 45 19 0 3 6 25 5 9 13 24 2 2 38 15 3 2 309 393 20 194 111 595 204 28 42 40 405 102 216 175 650 30 195 1077 100 62 44 5657 7579 20 194 111 1785 408 28 42 40 405 102 216 175 650 30 195 944 100 51 44 6907 8807 0.01 0.1 1 10 100 Favors TAVI Favors SAVR Knapp–Hartung random-effects OR and 95% CI for 30-day all-cause mortality stratified by study design. NOTION = Nordic Aortic Valve Intervention; OR = odds ratio; PARTNER = Placement of Aortic Transcatheter Valves; SAVR = surgical aortic valve replacement; STACCATO = A Prospective, Randomised Trial of Transapical Transcatheter Aortic Valve Implantation Versus Surgical Aortic Valve Replacement in Operable Elderly Patients With Aortic Stenosis; TAVI = transcatheter aortic valve implantation. * Percentages do not sum to 18.3% and 81.7% for randomized and matched studies, respectively, because of rounding. www.annals.org Annals of Internal Medicine • Vol. 165 No. 5 • 6 September 2016 337 Downloaded From: http://annals.org/ by a University of Liverpool User on 09/21/2016 Figure 1. Forest plot for early all-cause mortality in the overall population. Study (Reference) Randomized studies NOTION (9, 10) PARTNER (3–5) PARTNER 2A (11) STACCATO (26) U.S. CoreValve (6–8) Random-effects model Heterogeneity: l2 = 0%; tau-squared = 0; P = 0.4571 Matched studies Ailawadi et al (27) Appel et al (28) Biancari et al (29) Conradi et al (30) D'Onofrio et al (31) Fusari et al (33) Guarracino et al (34) Hannan et al (35) Higgins et al (36) Holzhey et al (37) Johansson et al (38) Jones et al (39) Kobrin et al (40) Latib et al (12) Minutello et al (41) Muneretto et al (42) Onorati et al (43) Events, n 3 12 39 2 13 69 34 3 10 6 2 0 3 19 6 14 4 0 20 2 20 20 1 OR (95% CI) 0.57 (0.13–2.45) 0.53 (0.26–1.10) 0.96 (0.61–1.50) 5.62 (0.26–121.32) 0.73 (0.35–1.55) 0.80 (0.51–1.25) 1.61 (0.92–2.81) 1.54 (0.24–9.66) 5.30 (1.14–24.63) 0.85 (0.27–2.63) 5.27 (0.24–113.60) 0.19 (0.01–4.06) 3.22 (0.32–32.89) 1.00 (0.52–1.92) 1.57 (0.41–6.00) 0.76 (0.36–1.58) 1.00 (0.23–4.31) 1.37 (0.68–2.77) 1.00 (0.14–7.23) 1.34 (0.79–2.30) 2.23 (1.16–4.27) 3.11 (0.12–79.64) Weight (Random), %* 1.8 4.7 6.9 0.5 4.5 18.3 5.9 1.2 1.6 2.6 0.5 0.5 0.8 5.2 2.1 4.6 1.8 0.0 4.8 1.1 6.1 5.2 0.4 Events, n 5 22 41 0 16 84 22 2 2 7 0 2 1 19 4 18 4 0 15 2 45 19 0 Total, n 139 348 1011 34 390 1922 340 45 144 82 38 30 30 405 46 167 40 20 194 111 595 204 28 Total, n 135 351 1021 36 357 1900 340 45 144 82 38 30 30 405 46 167 40 20 194 111 1785 408 28 TAVI SAVR Systematic Review and Meta-analysis of TAVI Versus SAVR REVIEW NB. 31 observational studies have been deleted from the reported forest plot Heterogeneity statistics Labelled table of raw data Effect sizes & confidence intervals Weights Pooled estimate Direction labels Nicely formatted axes Forest plot with null line
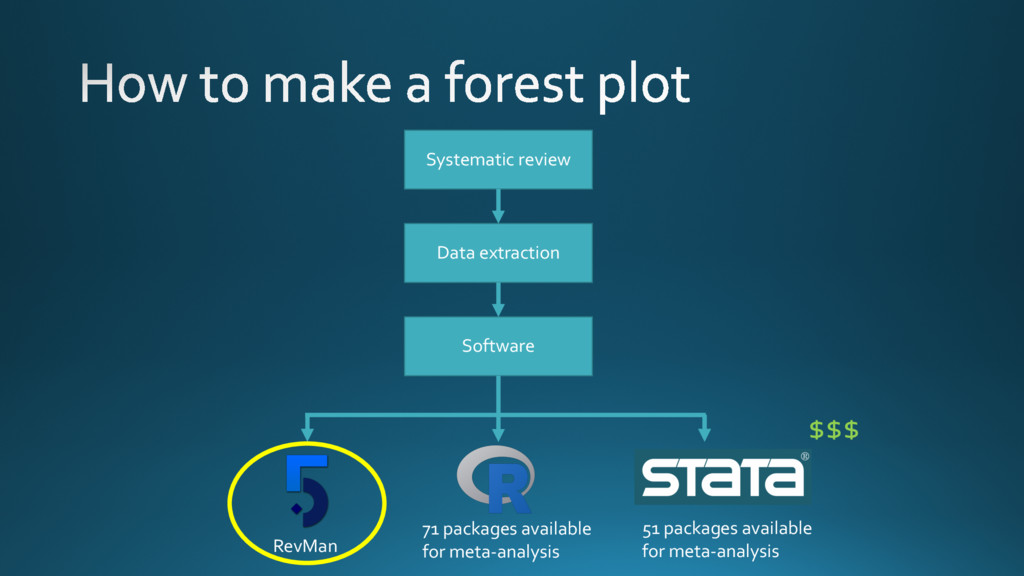
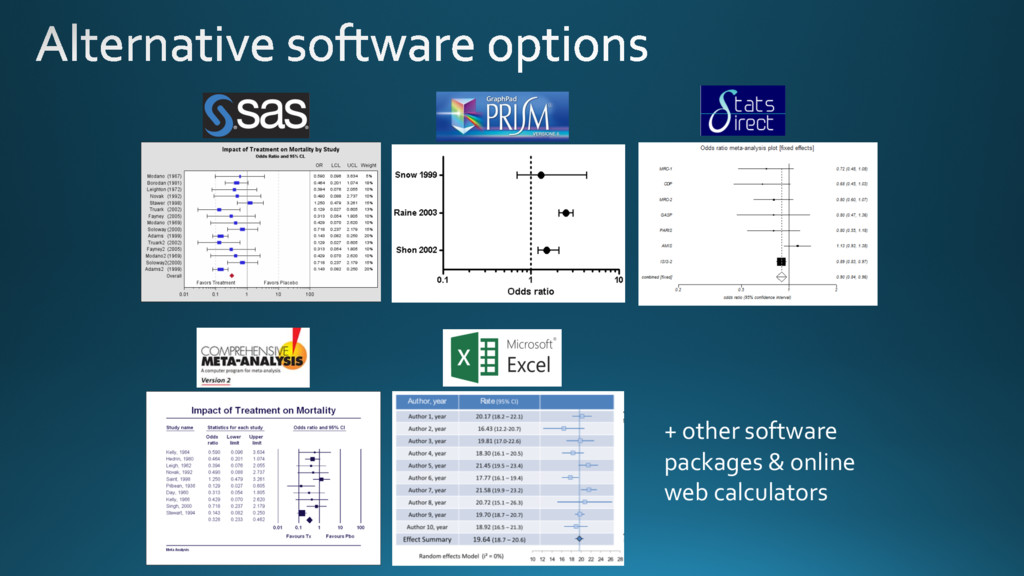
Systematic review Data extraction Software 51 packages available for meta-analysis
71 packages available for meta-analysis RevMan $$$
+ other software packages & online web calculators
* Only for preparation of Cochrane Reviews or for purely
academic use.
None
None
None
None
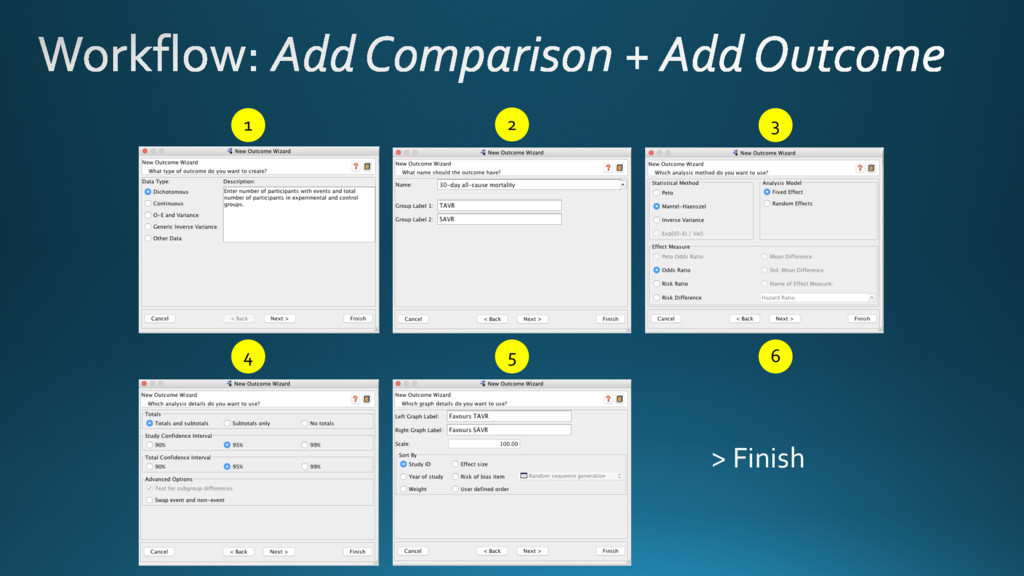
1 2 3 5 4 > Finish 6
None
None
None
None
None
None