Upgrade to Pro — share decks privately, control downloads, hide ads and more …

AAGW3 - Lieven Claessens - Global Yield Gap Atlas GYGA

CGIAR-CSI
March 21, 2013

AAGW3 - Lieven Claessens - Global Yield Gap Atlas GYGA

CGIAR-CSI

March 21, 2013
Tweet

More Decks by CGIAR-CSI

Other Decks in Research

Transcript

  1. Global Yield Gap Atlas (GYGA) www.yieldgap.org University of Nebraska (UNL)

    Wageningen University & Alterra Kenneth Cassman Patricio Grassini Martin van Ittersum Lenny van Bussel Joost Wolf Justin van Wart Haishun Yang Hendrik Boogaard Hugo de Groot Daniel van Kraalingen Regional coordinators and partners Lieven Claessens (ICRISAT) Kazuki Saito (Africa Rice) Funding sources: Gates Foundation (SSA, S Asia) UNL Water for Food Institute (N & S Amer) USAID (N Africa, Middle East)
  2. Project summary  www.yieldgap.org  2012-2013: maize, wheat, rice, sorghum,

    millet in 12 countries in SSA and S Asia (country agronomists partners)  2014-2015: complete global atlas for cereals, begin other crops-- cassava, potato, soybean, phaseolous bean, cowpea, sugarcane  Strong scientific foundation, robust, transparent, publicly available  “Bottoms-up” approach with regard to weather and crop management data at reference weather station locations; upscaling based on well defined agroecological zones  A living “wiki” format that allows for continuous improvement as data and simulation models improve
  3. Justification  Unexpected mega trends:  More rapid economic growth

    rates in the world’s most populous countries  Rapid rise in energy prices that causes convergence of energy and agriculture sectors  Stagnating yields of major food crops in some of the world’s most productive cropping systems
  4. Year 1950 1960 1970 1980 1990 2000 2010 2020 2030

    2040 2050 Population (x 109) 0 1 2 3 4 5 6 7 Rural Urban 70% 30% Can agriculture reliably provision an urban population of 6+ billion? 6 Source: http://esa.un.org/unup/index.asp
  5. Critical need for Global Yield Gap Atlas  To help

    interpret historical yield trends of the major food crops in a given country or region (and yield plateaus)  Estimate global food production capacity on existing farm land, or the additional land requirements due to land use change under different policy scenarios (e.g. biofuel, GMO)  Prioritize research and inform agricultural policies to ensure global food and water security  Identify areas with largest unexploited yield gaps; identify constraints; close yield gaps through ecological intensification  Identify where technology packages have greatest potential for success and impact (e.g. irrigation)
  6. Yield Gap Crop growth Simulation models Observed (surveys,…) Grain yield

    (Mg ha-1) Yield Potential (Yp) Water-limited yield (Yw) Actual farmers’ yields (Ya) Irrigated Rainfed Yield gaps (Yg) Yg Yg Radiation Temperature CO2 Genotype Planting date Plant density Radiation Temperature CO2 Genotype Planting date Plant density Water supply ‘Exploitable’ Yield 75-85% Of Yp or Yw
  7. Overview GYGA ‘bottom up’ Protocol 5) Scaling up results to

    country level 1) Identifying target areas for data collection (75% of cropped area, SPAM) 2) Data collection (weather, soils, mngt, Ya) 3) Simulation of Yp and Yw 4) Calculation of Yg 5) Upscaling of results with GYGA Extrapolation Domain
  8. GYGA Extrapolation Domain  Minimize climatic heterogeneity within the zone

    • Climate and management data observed anywhere within the zone are relevant/representative for any other area within the zone  Minimize number of zones that must be selected to sufficiently cover harvested area • Minimize data collection
  9. Extrapolation Domain for Yield Gap Analysis  Universal for all

    crops  Using 3 parameters: • Growing degree days (base temperature of 0°C) • Aridity index (AI, sum of annual precipitation divided by annual sum potential evapotranspiration) • Temperature seasonality (standard deviation of monthly temperature)  Only considered GDD, AI and temperature seasonality reported on geospatial area where food crops are grown  GDD and AI divided into 10 decile ranges; temperature seasonality divided into 3 quantile ranges: possible 300 zones Source: van Wart et al., FCR, 2013
  10. Objective analysis of different extrapolation domains  The GYGA ED

    has minimum climatic heterogeneity within zones while simultaneously requiring few zones to cover 75% of within country harvested area Source: van Wart et al., FCR, 2013
  11. Overview GYGA ‘bottom up’ Protocol 5) Scaling up results to

    country level 1) Identifying target areas for data collection (SPAM) 2) Data collection (weather, soils, mngt, Ya) 3) Simulation of Yp and Yw 4) Calculation of Yg 5) Upscaling of results with GYGA Extrapolation Domain
  12. Next steps  Populate atlas (more crops, global)  Strengthen

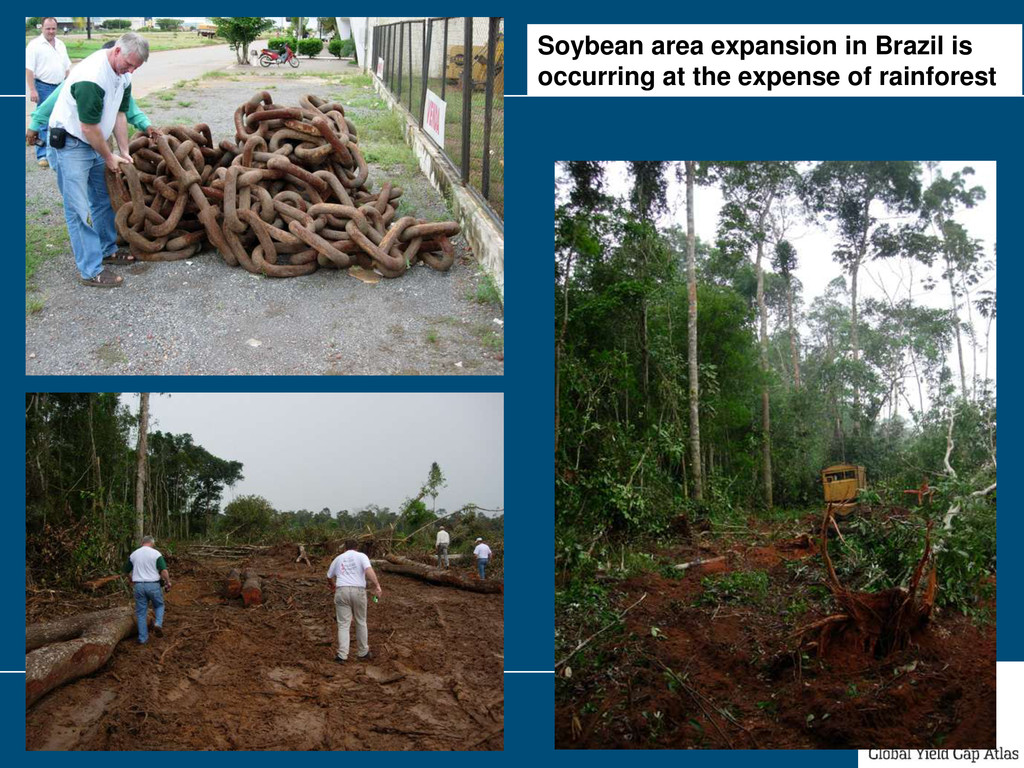
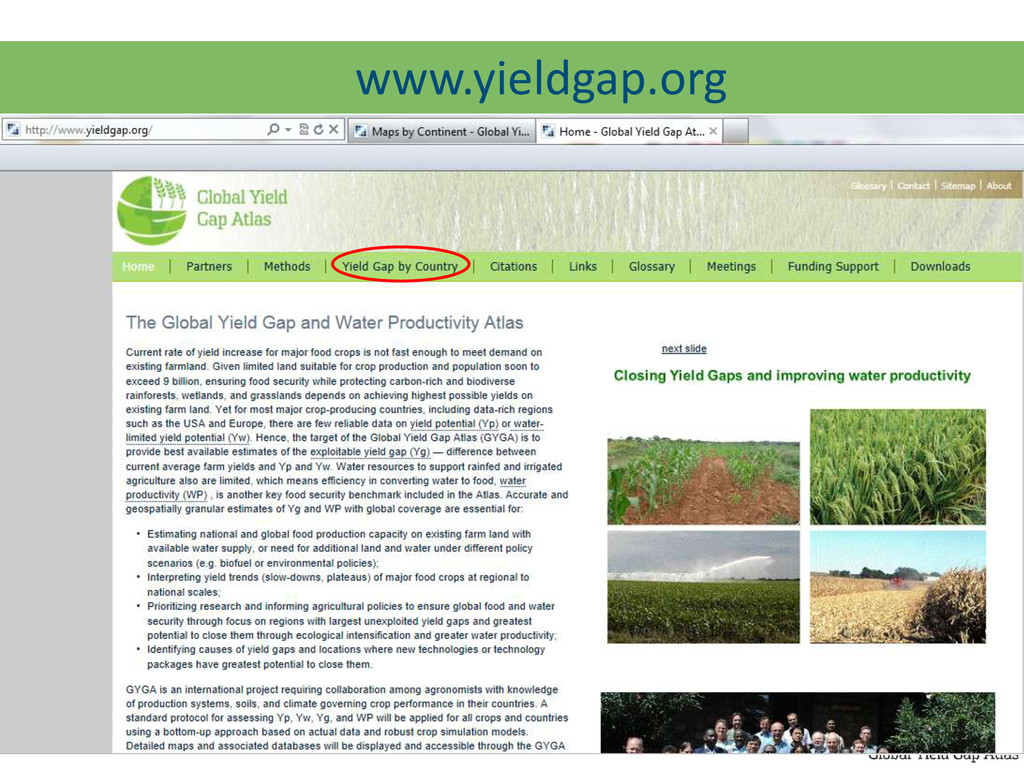
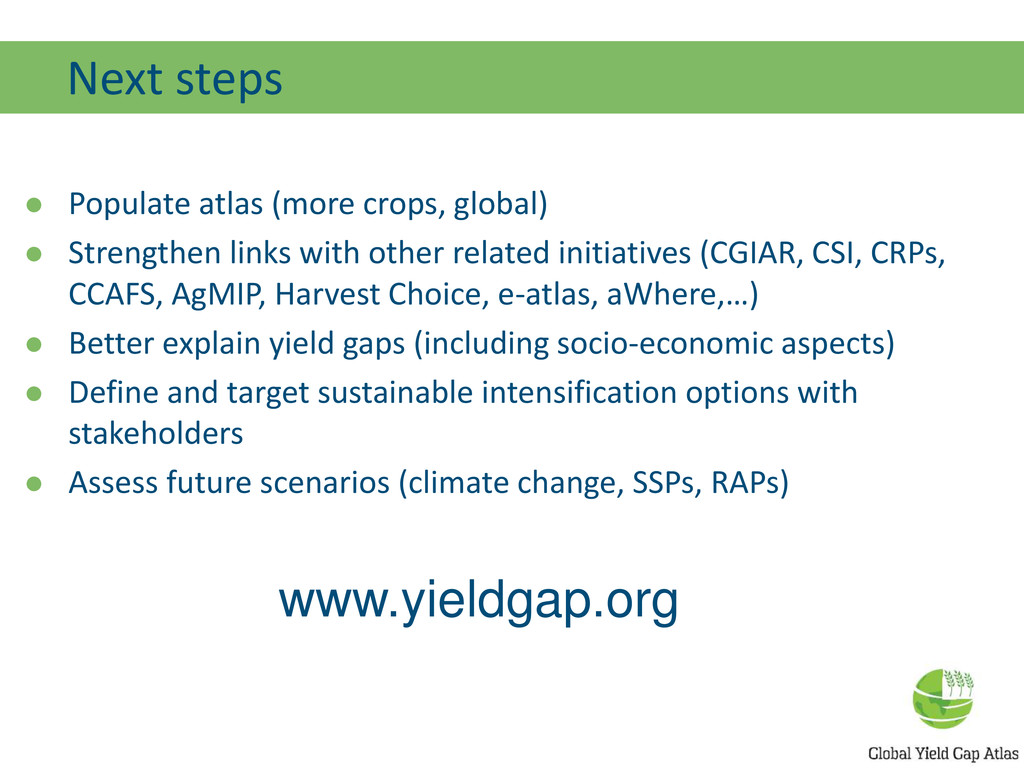
    links with other related initiatives (CGIAR, CSI, CRPs, CCAFS, AgMIP, Harvest Choice, e-atlas, aWhere,…)  Better explain yield gaps (including socio-economic aspects)  Define and target sustainable intensification options with stakeholders  Assess future scenarios (climate change, SSPs, RAPs) www.yieldgap.org