Upgrade to Pro — share decks privately, control downloads, hide ads and more …

AAGW3 - Stefan Siebert - A global perspective on water use in agriculture

CGIAR-CSI
March 21, 2013

AAGW3 - Stefan Siebert - A global perspective on water use in agriculture

CGIAR-CSI

March 21, 2013
Tweet

More Decks by CGIAR-CSI

Other Decks in Research

Transcript

  1. AAGW3 - GEOSHARE event, ILRI Campus Addis, March 2013 Outline

    Introduction Global irrigation mapping Crop mapping / modeling GEOSHARE data products A global perspective on water use in agriculture  Introduction – support of regional studies by global data sets  Mapping of irrigated area and irrigated crops  Modeling of crop water requirements and virtual water flows  The need for a new generation of global data products Stefan Siebert (University of Bonn)
  2. AAGW3 - GEOSHARE event, ILRI Campus Addis, March 2013 Introduction

    Research focus 02 Introduction Global irrigation mapping Crop mapping / modeling GEOSHARE data products
  3. AAGW3 - GEOSHARE event, ILRI Campus Addis, March 2013 Introduction

    Benefits from global data sets Balance between incoming and outgoing virtual water flows (19 crops, 1998-2002) 03 Blue (irrigation) water Green (rain) water Hoff et al. (2013) Hoff et al. (2013) Introduction Global irrigation mapping Crop mapping / modeling GEOSHARE data products
  4. AAGW3 - GEOSHARE event, ILRI Campus Addis, March 2013 Introduction

    Balance between incoming and outgoing virtual water flows (19 crops, 1998-2002) 04 Blue (irrigation) water Green (rain) water Hoff et al. (2013) Hoff et al. (2013) Introduction Global irrigation mapping Crop mapping / modeling GEOSHARE data products
  5. AAGW3 - GEOSHARE event, ILRI Campus Addis, March 2013 Introduction

    05 Virtual water flows to Berlin (Germany) Hoff et al. (2013) Introduction Global irrigation mapping Crop mapping / modeling GEOSHARE data products
  6. AAGW3 - GEOSHARE event, ILRI Campus Addis, March 2013 Introduction

    05 Virtual water flows to Berlin (Germany) Long distance links between producers and consumers of crops established in a globalized world Resource use (soil, water, nutrients, labor, …) in the production area affected by decisions of consumers or the productivity of competing producers far away We can map resource use and its change at the small scale with high precision, but to understand it we also need information about the whole picture => global data sets Introduction Global irrigation mapping Crop mapping / modeling GEOSHARE data products
  7. AAGW3 - GEOSHARE event, ILRI Campus Addis, March 2013 Mapping

    of irrigated areas (Global Map of Irrigation Areas) Collaboration with FAO, 6 versions already released since 1999 06 http://www.fao.org/nr/water/aquastat/irrigationmap/index.stm Introduction Global irrigation mapping Crop mapping / modeling GEOSHARE data products
  8. AAGW3 - GEOSHARE event, ILRI Campus Addis, March 2013 Mapping

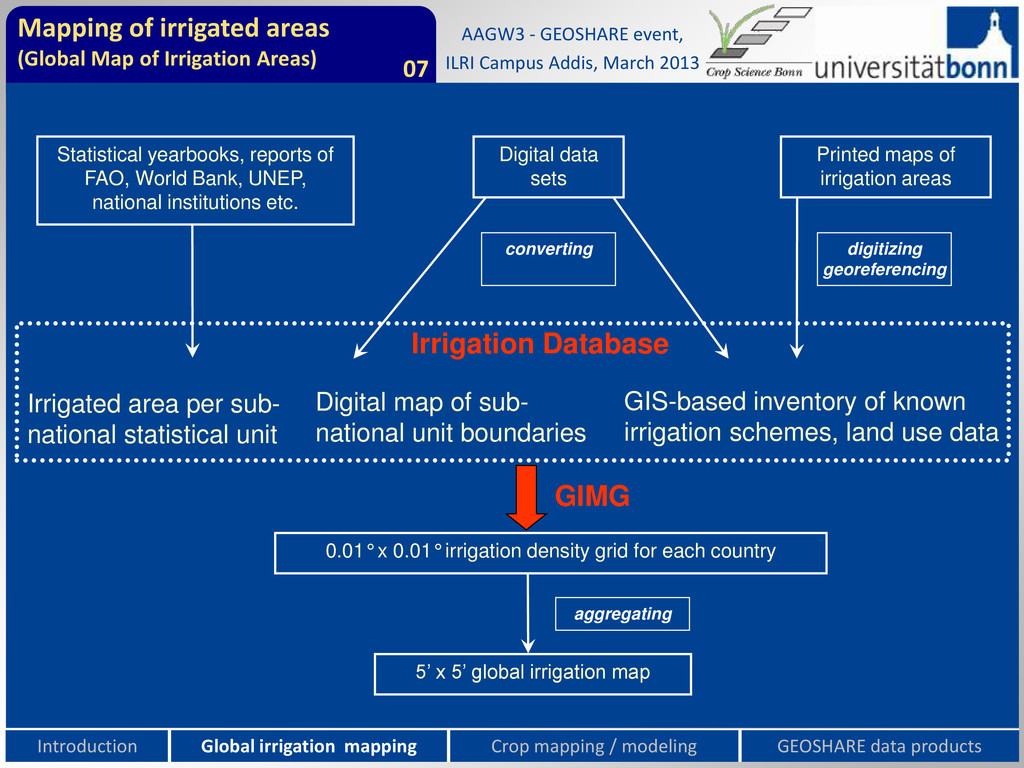
    of irrigated areas (Global Map of Irrigation Areas) 07 Statistical yearbooks, reports of FAO, World Bank, UNEP, national institutions etc. Printed maps of irrigation areas Digital data sets digitizing georeferencing converting GIS-based inventory of known irrigation schemes, land use data Irrigation Database Irrigated area per sub- national statistical unit Digital map of sub- national unit boundaries 0.01° x 0.01° irrigation density grid for each country 5’ x 5’ global irrigation map aggregating GIMG Introduction Global irrigation mapping Crop mapping / modeling GEOSHARE data products
  9. AAGW3 - GEOSHARE event, ILRI Campus Addis, March 2013 Mapping

    of irrigated areas (Global Map of Irrigation Areas) 08 Area under agricultural water management Area equipped for irrigation Areas with other forms of agricultural water management Area equipped for full/partial control irrigation Equipped lowlands Spate irrigation Non-equipped cultivated wetlands and inland valley bottoms Non-equipped flood recession cropping Surface irrigation Sprinkler irrigation Localized irrigation Equipped wetlands and inland valley bootoms Equipped flood recession Other Dataset is following the standard FAO terminology and classifications Introduction Global irrigation mapping Crop mapping / modeling GEOSHARE data products
  10. AAGW3 - GEOSHARE event, ILRI Campus Addis, March 2013 Mapping

    of irrigated areas (Global Map of Irrigation Areas) 09 Assignment of irrigated areas to specific grid cells within the sub-national units Point records (position of irrigation projects) with known command area Point records without known command area Polygon records (outlines or irrigation schemes) with known command area Polygon records without known command area Other less reliable records (e.g. zones containing unregistered irrigated areas) Areas potentially irrigated as derived from global land cover inventories Priority 10 Priority 1 High priority Medium priority Low priority Introduction Global irrigation mapping Crop mapping / modeling GEOSHARE data products
  11. AAGW3 - GEOSHARE event, ILRI Campus Addis, March 2013 Mapping

    of irrigated areas (Global Map of Irrigation Areas) 10 Map version 3 (2005) Census or survey based statistics on area equipped for irrigation for: 10825 administrative units Total area equipped for irrigation: 273.7 million ha Introduction Global irrigation mapping Crop mapping / modeling GEOSHARE data products
  12. AAGW3 - GEOSHARE event, ILRI Campus Addis, March 2013 Mapping

    of irrigated areas (Global Map of Irrigation Areas) 11 Map version 4 (2007) Census or survey based statistics on area equipped for irrigation for: 26909 administrative units Total area equipped for irrigation: 278.8 million ha Introduction Global irrigation mapping Crop mapping / modeling GEOSHARE data products
  13. AAGW3 - GEOSHARE event, ILRI Campus Addis, March 2013 Mapping

    of irrigated areas (Global Map of Irrigation Areas) 12 Preview to map version 5 (2013) – Area equipped for irrigation Census or survey based statistics on area equipped for irrigation for: 36090 administrative units Total area equipped for irrigation: 307.6 million ha Introduction Global irrigation mapping Crop mapping / modeling GEOSHARE data products
  14. AAGW3 - GEOSHARE event, ILRI Campus Addis, March 2013 Mapping

    of irrigated areas (Global Map of Irrigation Areas) 13 Preview to map version 5 (2013) – Area equipped for irrigation with groundwater (%) Census or survey based statistics on the water source for irrigation: 14483 administrative units Total area equipped for irrigation with groundwater: 116.2 million ha (% of total AEI) Introduction Global irrigation mapping Crop mapping / modeling GEOSHARE data products
  15. AAGW3 - GEOSHARE event, ILRI Campus Addis, March 2013 Mapping

    of irrigated areas (Global Map of Irrigation Areas) 14 Preview to map version 5 (2013) – Area actually irrigated (% of equipped area) Census or survey based statistics on area equipped for irrigation for: 10316 administrative units Total area equipped for irrigation: 255.2 million ha (83% of AEI) Introduction Global irrigation mapping Crop mapping / modeling GEOSHARE data products
  16. AAGW3 - GEOSHARE event, ILRI Campus Addis, March 2013 Historical

    irrigation data base - Harmonization of input data - Filling of data gaps - Downscaling of statistics to grid cell level Census data Historical irrigation maps Publications 15 Mapping of irrigated areas (Historical irrigation extent) Preview to first version of data set on historical irrigation extent (1900-2000, 10 year steps) Introduction Global irrigation mapping Crop mapping / modeling GEOSHARE data products
  17. AAGW3 - GEOSHARE event, ILRI Campus Addis, March 2013 Irrigated

    crops (MIRCA2000, IFPRI SPAM) MIRCA2000 (Portmann et al., 2010) IFPRI SPAM (You et al., 2006) Irrigated and rainfed crop areas around year 2000 (harvested area) irrigated rainfed Wheat 0 0.5 5 20 50 100 190 Harvested area as percentage of 5 arc-minute cell area 16 Introduction Global irrigation mapping Crop mapping / modeling GEOSHARE data products
  18. AAGW3 - GEOSHARE event, ILRI Campus Addis, March 2013 Cropping

    intensity Siebert et al. (2010) Cropping intensity (including fallow) In irrigated regions cropping intensity is typically larger than in rainfed agriculture 17 Introduction Global irrigation mapping Crop mapping / modeling GEOSHARE data products
  19. AAGW3 - GEOSHARE event, ILRI Campus Addis, March 2013 Irrigation

    water use Irrigation water requirement (mm yr-1) Consumptive irrigation water use about 1180 km3 yr-1 in year 2000, of which 307 km³ yr-1 was for rice and 207 km3 yr-1 for wheat Siebert and Döll, 2010 18 Introduction Global irrigation mapping Crop mapping / modeling GEOSHARE data products
  20. AAGW3 - GEOSHARE event, ILRI Campus Addis, March 2013 Irrigation

    water use Irrigation water use (percentage of total water use of irrigated crops) Globally averaged, 56% of the total water requirement of irrigated crops is from irrigation and 44% from precipitation stored in the soil Siebert and Döll, 2010 19 Introduction Global irrigation mapping Crop mapping / modeling GEOSHARE data products
  21. AAGW3 - GEOSHARE event, ILRI Campus Addis, March 2013 Crop

    productivity 20.3% production loss of cereals when not using irrigation 614 km3 of irrigation water requirement of cereals replace the use of 1.328 million km2 cereal production area that were required additionally without irrigation => 4623 m3 water per ha of cereal growing area Siebert and Döll (2010) 20 Introduction Global irrigation mapping Crop mapping / modeling GEOSHARE data products
  22. AAGW3 - GEOSHARE event, ILRI Campus Addis, March 2013 Collaboration

    with GEOSHARE global node at McGill University Cropland and pasture extent in year 2000 Harvested crop area And crop production (M3) Monthly irrigated and rainfed crop areas (MIRCA2000) FAO Cropland and pasture extent (national level) National census data Cropland and pasture extent (subnational level) + Remote sensing data + = H H FAO Harvested crop area (national level) National census data Harvested crop area (subnational level) + Assumptions related to cropping intensity + = H Area equipped for irrigation (gridded product) FAO + National census data Irrigated and rainfed crop area (sub)-national level) + Crop calendars + = H H 1 2 3 H H H H 21 Introduction Global irrigation mapping Crop mapping / modeling GEOSHARE data products
  23. AAGW3 - GEOSHARE event, ILRI Campus Addis, March 2013 22

    Collaboration with GEOSHARE regional node at IRRI Introduction Global irrigation mapping Crop mapping / modeling GEOSHARE data products
  24. AAGW3 - GEOSHARE event, ILRI Campus Addis, March 2013 http://www.dailypictures.info

    Thank you! ☺ Introduction Global irrigation mapping Crop mapping / modeling GEOSHARE data products
  25. AAGW3 - GEOSHARE event, ILRI Campus Addis, March 2013 Introduction

    Research questions related to development of large scale data sets XX  How much land with irrigation infrastructure is available, where is it located?  From which sources is irrigation water extracted?  Which crops are when and where irrigated, which crops are rainfed?  How large are yields and production in irrigated and rainfed agriculture?  How much water is used by crops and where is it coming from?  Which links are established between producers and consumers of crops? ? ? ? ? ? Explaining patterns and dynamics Introduction Global irrigation mapping Crop mapping / modeling GEOSHARE data products