Indus- trial Park is Okla- homa’s largest, serving nearly 80 compa- nies and set on 9,000 acres in Mayes County east of Tulsa. We produced a 24- page report on which this poster is based that covers key demographic, econom- ic, and work- force statistics in the region. This report will serve as a launching pad for developing a strategic plan to grow the park into a community where Oklaho- mans can live, work and play. THE primary area selected for this study is com- prised of five counties: Cherokee, Delaware, Mayes, Rogers and Wagoner. This area will be re- ferred to in this poster as the MAIP Region. Tulsa County data has also been included as a secondary geographic territory for addition or comparison to the MAIP Region. ^ Tulsa DELAWARE ROGERS MAYES TULSA CHEROKEE WAGONER MidAmerica Industrial Park Claremore Glenpool Grove Owasso Pryor Tahlequah Wagoner MAIP Region County Boundaries Highways By Marcus Arreguin, Rogers State University, OK - Website: RSUinnovation.com - Email:
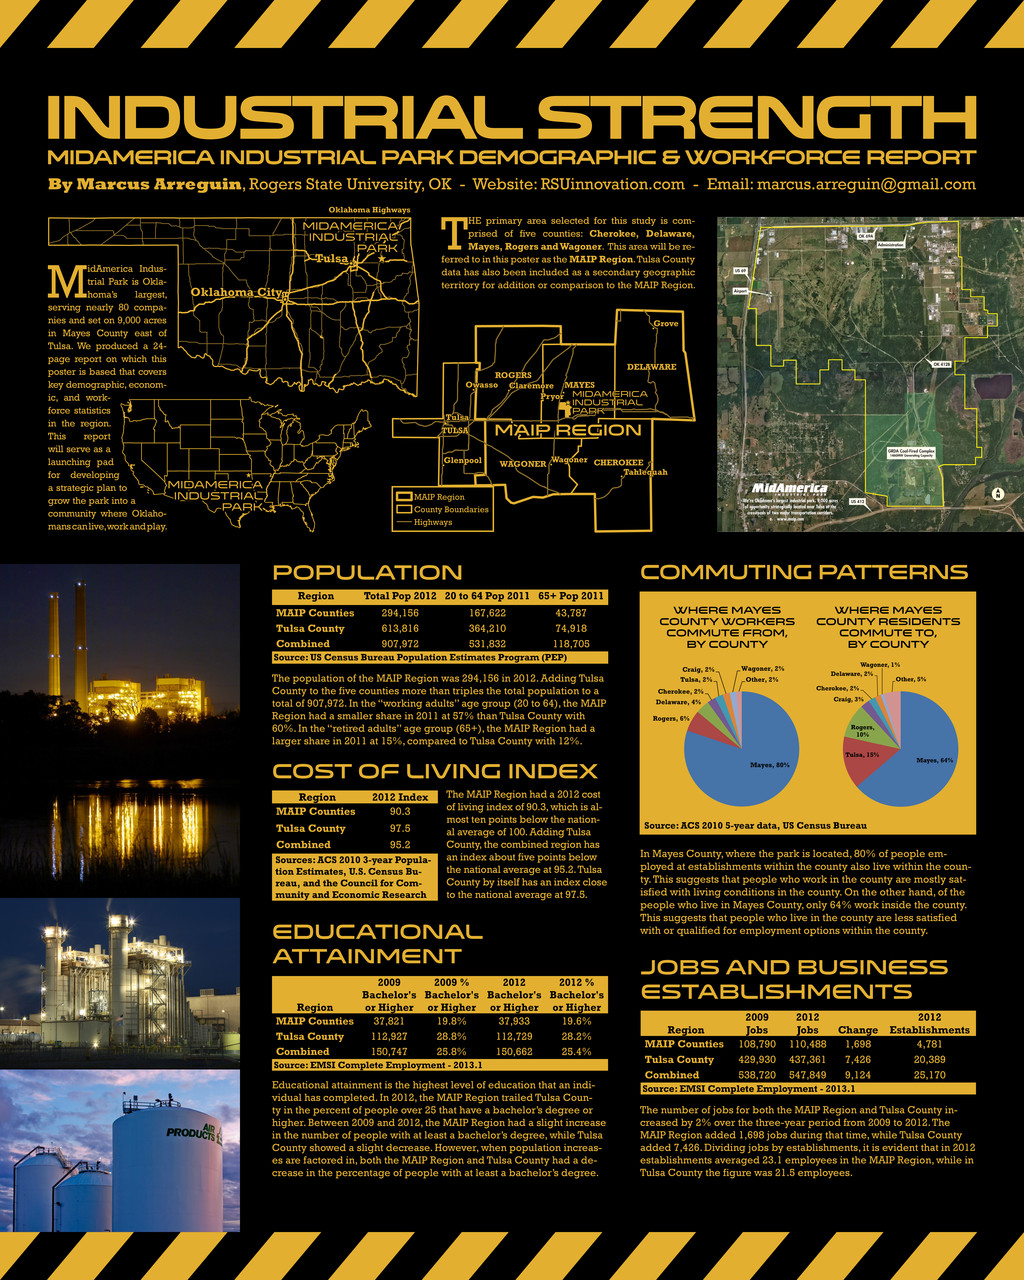
[email protected] Population Region Total Pop 2012 20 to 64 Pop 2011 65+ Pop 2011 MAIP Counties 294,156 167,622 43,787 Tulsa County 613,816 364,210 74,918 Combined 907,972 531,832 118,705 Source: US Census Bureau Population Estimates Program (PEP) The population of the MAIP Region was 294,156 in 2012. Adding Tulsa County to the five counties more than triples the total population to a total of 907,972. In the “working adults” age group (20 to 64), the MAIP Region had a smaller share in 2011 at 57% than Tulsa County with 60%. In the “retired adults” age group (65+), the MAIP Region had a larger share in 2011 at 15%, compared to Tulsa County with 12%. Cost of living index Region 2012 Index MAIP Counties 90.3 Tulsa County 97.5 Combined 95.2 Sources: ACS 2010 3-year Popula- tion Estimates, U.S. Census Bu- reau, and the Council for Com- munity and Economic Research The MAIP Region had a 2012 cost of living index of 90.3, which is al- most ten points below the nation- al average of 100. Adding Tulsa County, the combined region has an index about five points below the national average at 95.2. Tulsa County by itself has an index close to the national average at 97.5. Commuting Patterns Where Mayes County Residents Commute to, by County In Mayes County, where the park is located, 80% of people em- ployed at establishments within the county also live within the coun- ty. This suggests that people who work in the county are mostly sat- isfied with living conditions in the county. On the other hand, of the people who live in Mayes County, only 64% work inside the county. This suggests that people who live in the county are less satisfied with or qualified for employment options within the county. Where Mayes County Workers Commute from, by County Jobs and Business Establishments The number of jobs for both the MAIP Region and Tulsa County in- creased by 2% over the three-year period from 2009 to 2012. The MAIP Region added 1,698 jobs during that time, while Tulsa County added 7,426. Dividing jobs by establishments, it is evident that in 2012 establishments averaged 23.1 employees in the MAIP Region, while in Tulsa County the figure was 21.5 employees. Region 2009 Jobs 2012 Jobs Change 2012 Establishments MAIP Counties 108,790 110,488 1,698 4,781 Tulsa County 429,930 437,361 7,426 20,389 Combined 538,720 547,849 9,124 25,170 Source: EMSI Complete Employment - 2013.1 Educational Attainment Educational attainment is the highest level of education that an indi- vidual has completed. In 2012, the MAIP Region trailed Tulsa Coun- ty in the percent of people over 25 that have a bachelor’s degree or higher. Between 2009 and 2012, the MAIP Region had a slight increase in the number of people with at least a bachelor’s degree, while Tulsa County showed a slight decrease. However, when population increas- es are factored in, both the MAIP Region and Tulsa County had a de- crease in the percentage of people with at least a bachelor’s degree. Region 2009 Bachelor's or Higher 2009 % Bachelor's or Higher 2012 Bachelor's or Higher 2012 % Bachelor's or Higher MAIP Counties 37,821 19.8% 37,933 19.6% Tulsa County 112,927 28.8% 112,729 28.2% Combined 150,747 25.8% 150,662 25.4% Source: EMSI Complete Employment - 2013.1 Source: ACS 2010 5-year data, US Census Bureau Mayes, 64% Tulsa, 15% Rogers, 10% Craig, 3% Cherokee, 2% Delaware, 2% Wagoner, 1% Other, 5% Mayes, 80% Rogers, 6% Delaware, 4% Cherokee, 2% Tulsa, 2% Craig, 2% Wagoner, 2% Other, 2% ^ Tulsa Oklahoma City midamerica industrial park Oklahoma Highways ^ midamerica industrial park MAIP Region